 11
11peptides
spectra
0.000 | 0.000
0.810 | 0.838
0.000 | 0.000
0.000 | 0.000
0.000 | 0.000
0.000 | 0.024
0.154 | 0.169
0.000 | 0.000
| Plot | Mito | Lyso | Perox | ER | Golgi | PM | Cytosol | Nucleus | |||||
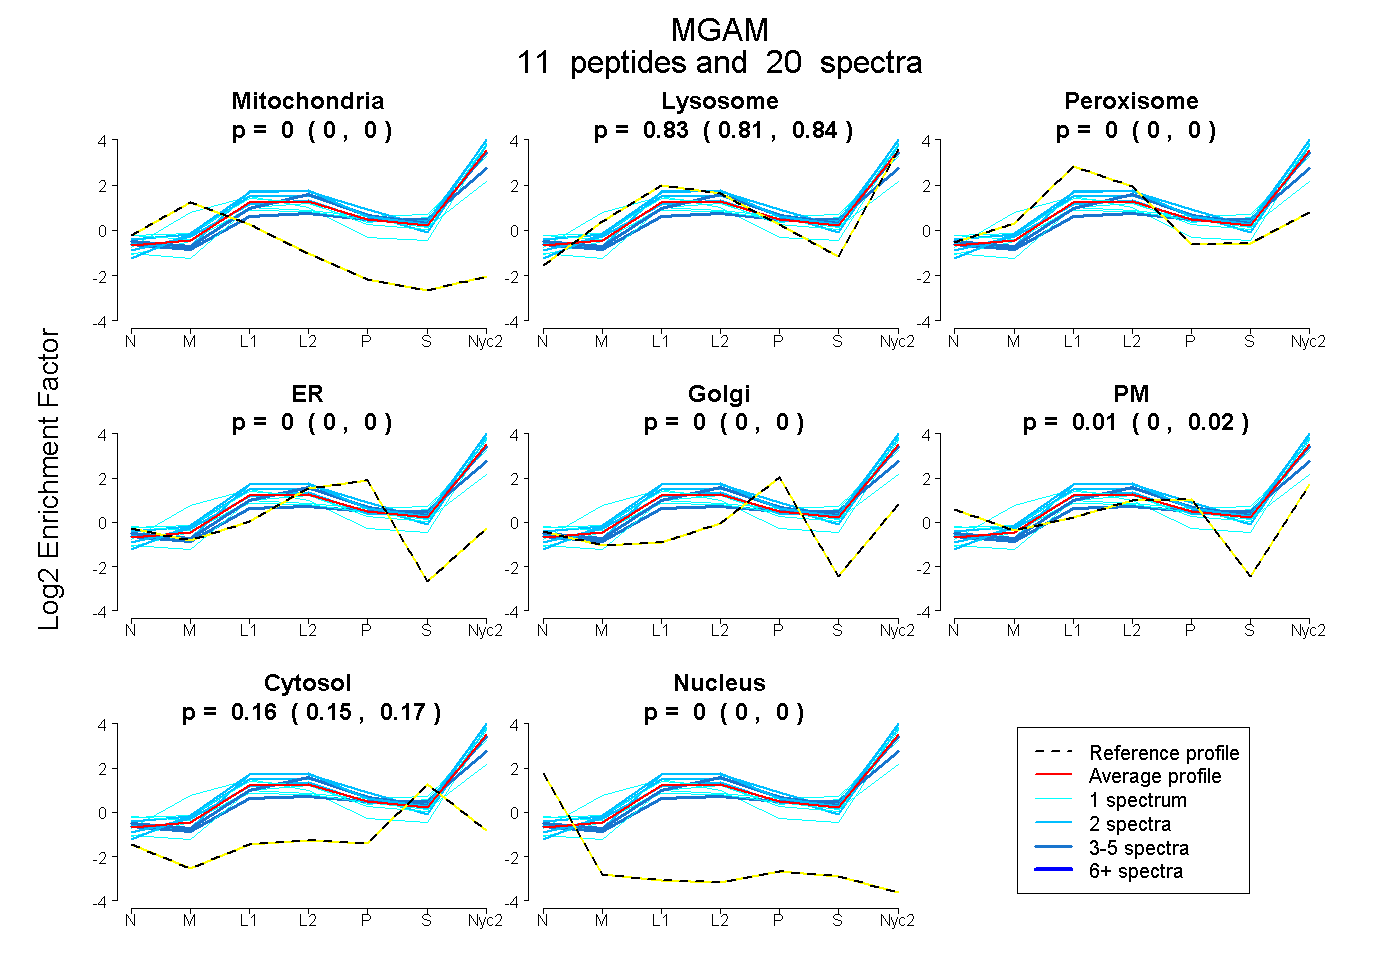
| Expt A |
11 peptides |
20 spectra |
|
0.000 0.000 | 0.000 |
0.826 0.810 | 0.838 |
0.000 0.000 | 0.000 |
0.000 0.000 | 0.000 |
0.000 0.000 | 0.000 |
0.012 0.000 | 0.024 |
0.162 0.154 | 0.169 |
0.000 0.000 | 0.000 |
| 1 spectrum, HYLNIR | 0.000 | 0.446 | 0.091 | 0.000 | 0.000 | 0.227 | 0.235 | 0.000 | ||
| 2 spectra, IFGTQEIR | 0.000 | 0.874 | 0.000 | 0.000 | 0.000 | 0.000 | 0.126 | 0.000 | ||
| 1 spectrum, GIVLTR | 0.000 | 0.724 | 0.000 | 0.000 | 0.000 | 0.000 | 0.276 | 0.000 | ||
| 1 spectrum, AYVAFPDFFR | 0.016 | 0.917 | 0.000 | 0.000 | 0.000 | 0.000 | 0.064 | 0.004 | ||
| 3 spectra, IGLHLR | 0.000 | 0.758 | 0.000 | 0.000 | 0.000 | 0.080 | 0.161 | 0.000 | ||
| 2 spectra, TFEDISR | 0.000 | 0.946 | 0.000 | 0.000 | 0.000 | 0.000 | 0.054 | 0.000 | ||
| 1 spectrum, SVLETR | 0.000 | 0.830 | 0.000 | 0.000 | 0.000 | 0.074 | 0.096 | 0.000 | ||
| 1 spectrum, DQMLQFK | 0.000 | 0.816 | 0.000 | 0.000 | 0.000 | 0.000 | 0.184 | 0.000 | ||
| 2 spectra, EIEELYR | 0.000 | 0.838 | 0.000 | 0.000 | 0.000 | 0.111 | 0.051 | 0.000 | ||
| 2 spectra, GVENDVFIR | 0.000 | 0.910 | 0.000 | 0.000 | 0.000 | 0.020 | 0.070 | 0.000 | ||
| 4 spectra, ENPFGIQIR | 0.000 | 0.622 | 0.000 | 0.000 | 0.000 | 0.076 | 0.302 | 0.000 |
| Plot | Mito | Lyso or Perox | ER | Golgi | PM | Cytosol | Nucleus | ||||||
| Expt B |
1 peptide |
1 spectrum |
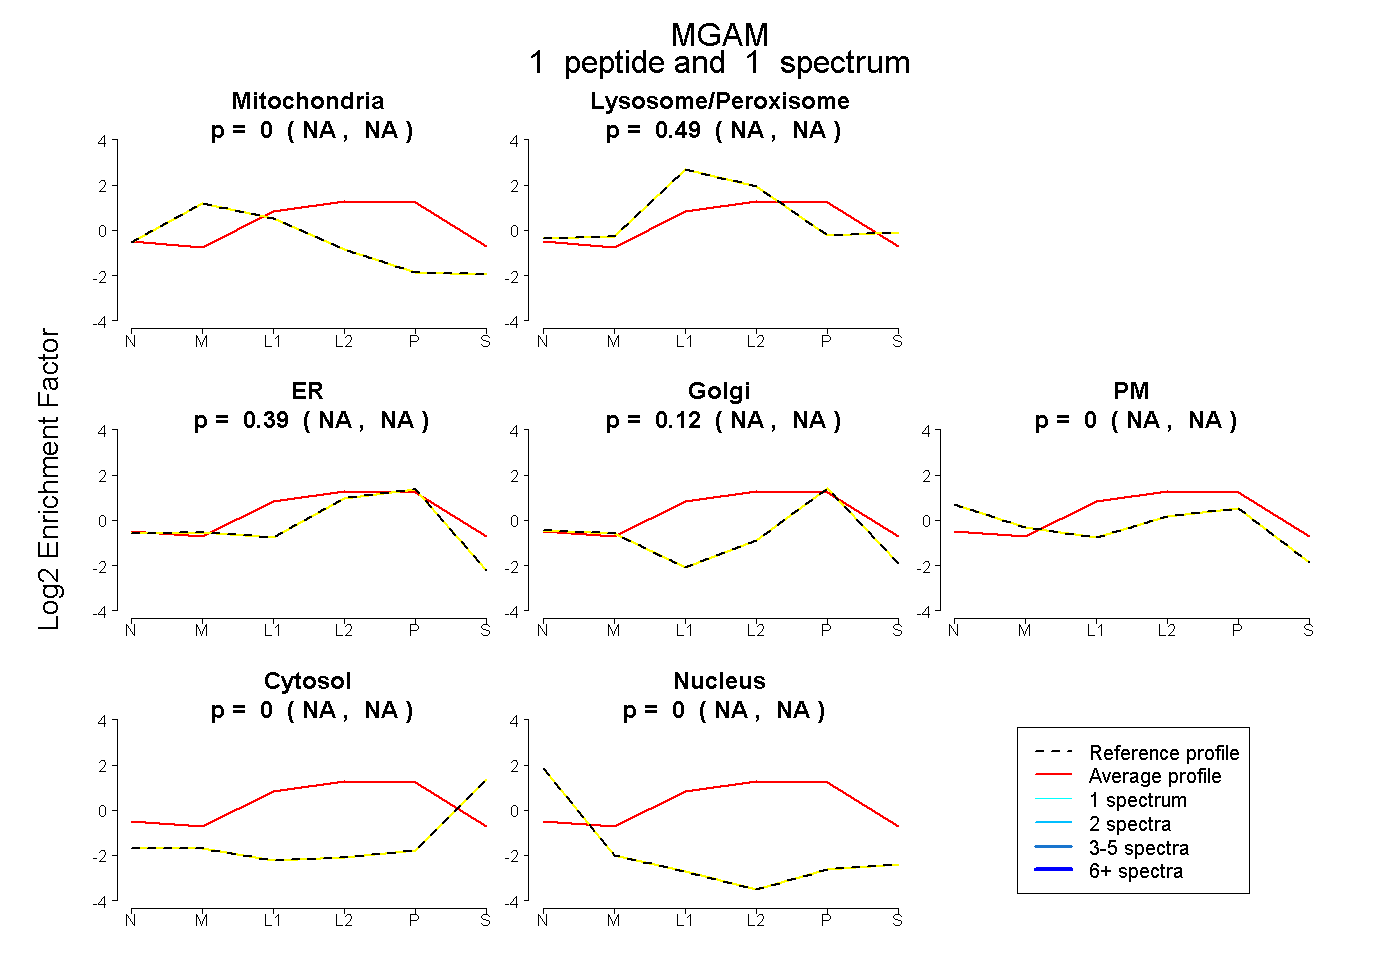 |
0.000 NA | NA |
0.490 NA | NA |
0.392 NA | NA |
0.119 NA | NA |
0.000 NA | NA |
0.000 NA | NA |
0.000 NA | NA |
|||
| Plot | Lyso | Other | |||||||||||
| Expt C |
16 peptides |
50 spectra |
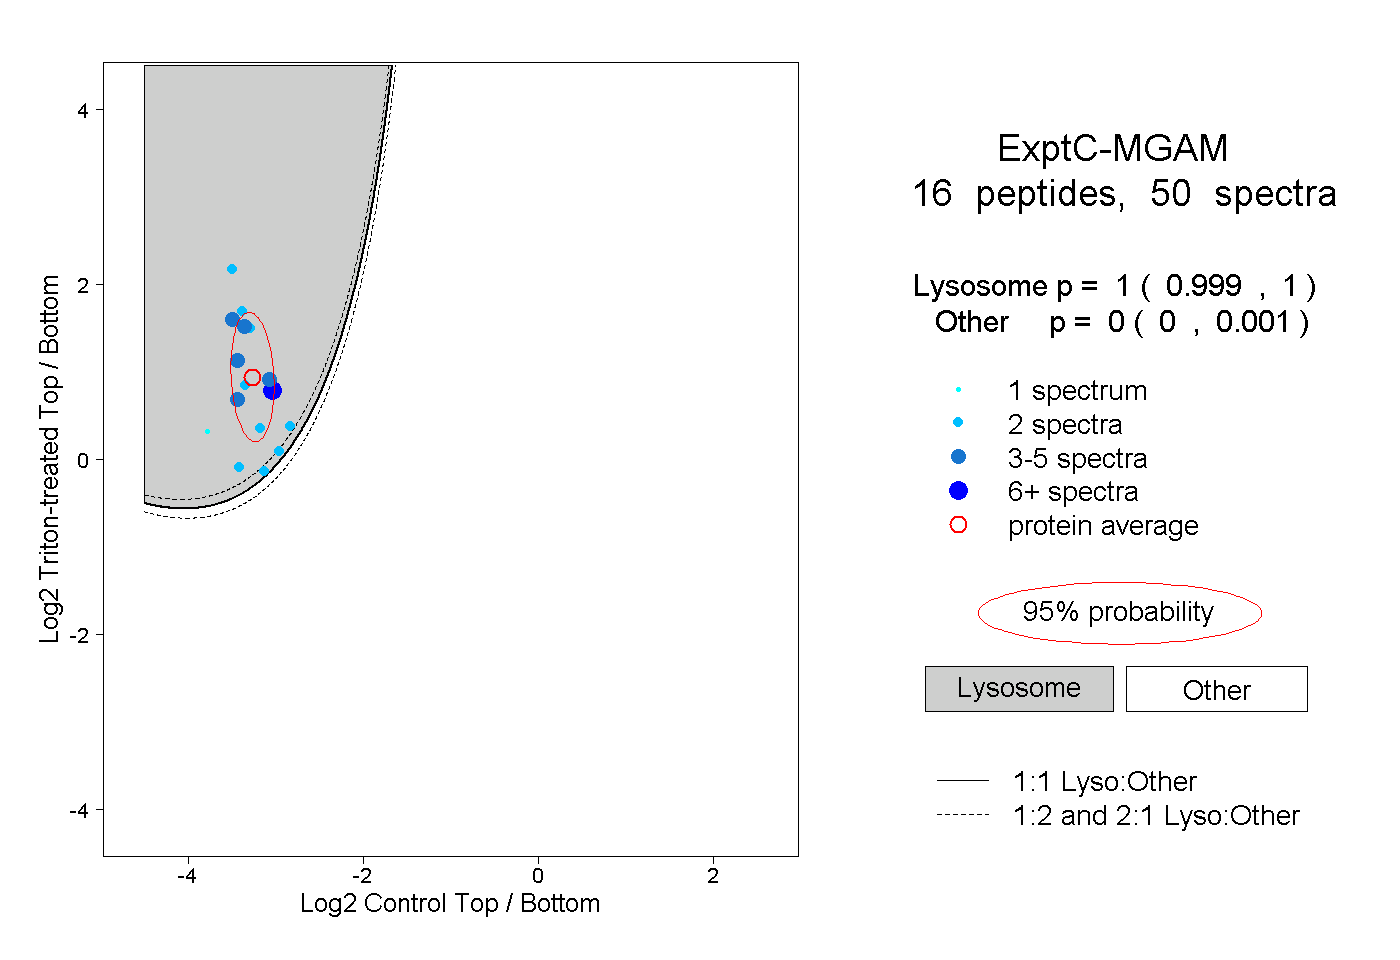 |
1.000 0.999 | 1.000 |
0.000 0.000 | 0.001 |
||||||||
| Plot | Lyso | Other | |||||||||||
| Expt D |
5 peptides |
6 spectra |
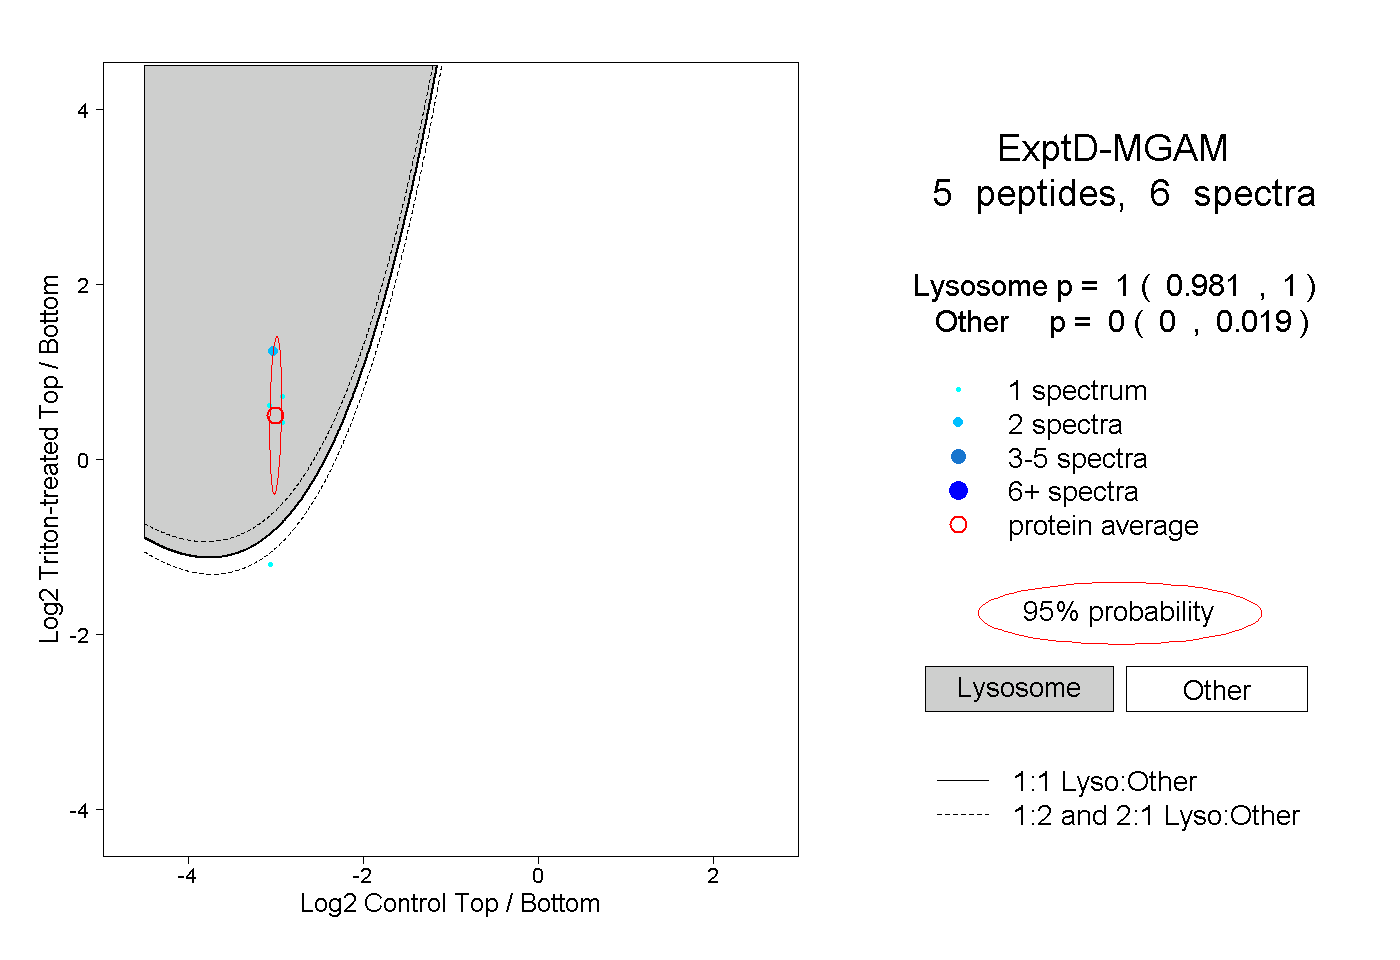 |
1.000 0.981 | 1.000 |
0.000 0.000 | 0.019 |