 11
11peptides
spectra
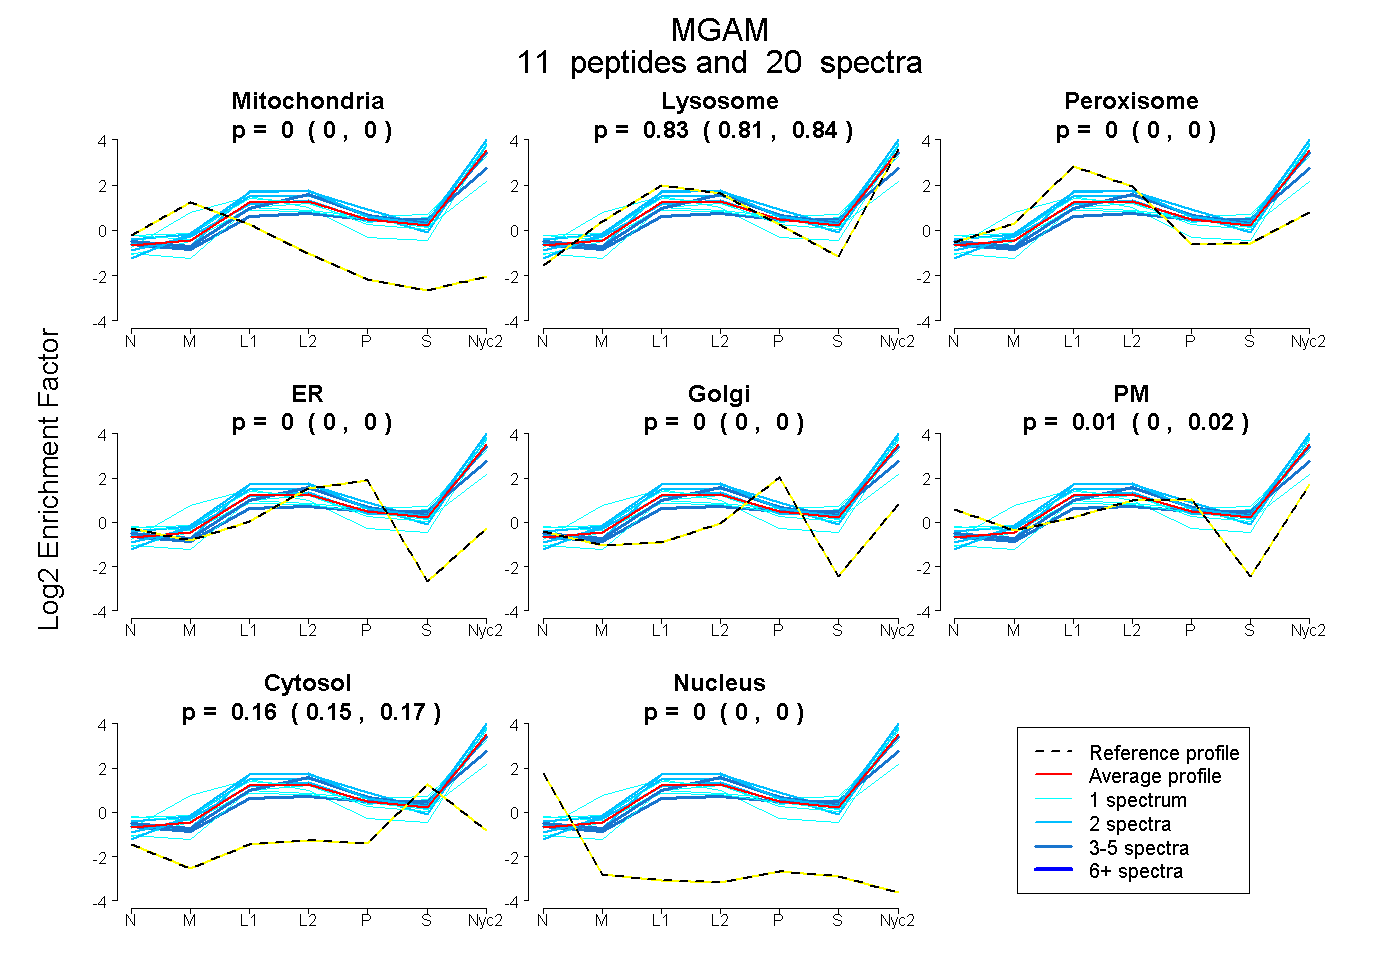
0.000 | 0.000
0.810 | 0.838
0.000 | 0.000
0.000 | 0.000
0.000 | 0.000
0.000 | 0.024
0.154 | 0.169
0.000 | 0.000
1peptide
spectrum
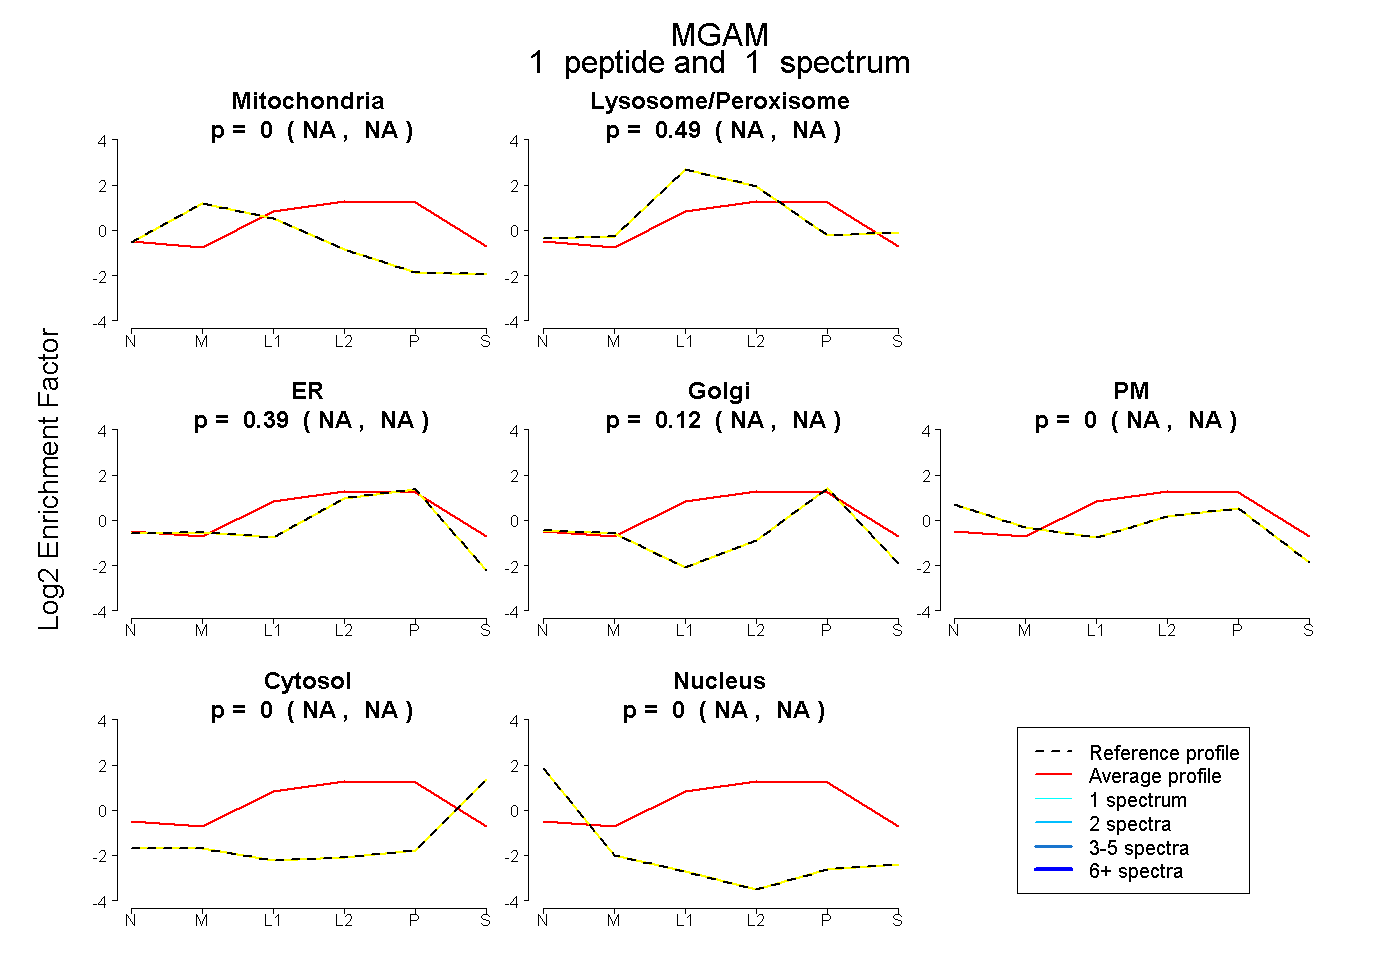
NA | NA
NA | NA
NA | NA
NA | NA
NA | NA
NA | NA
NA | NA
16peptides
spectra
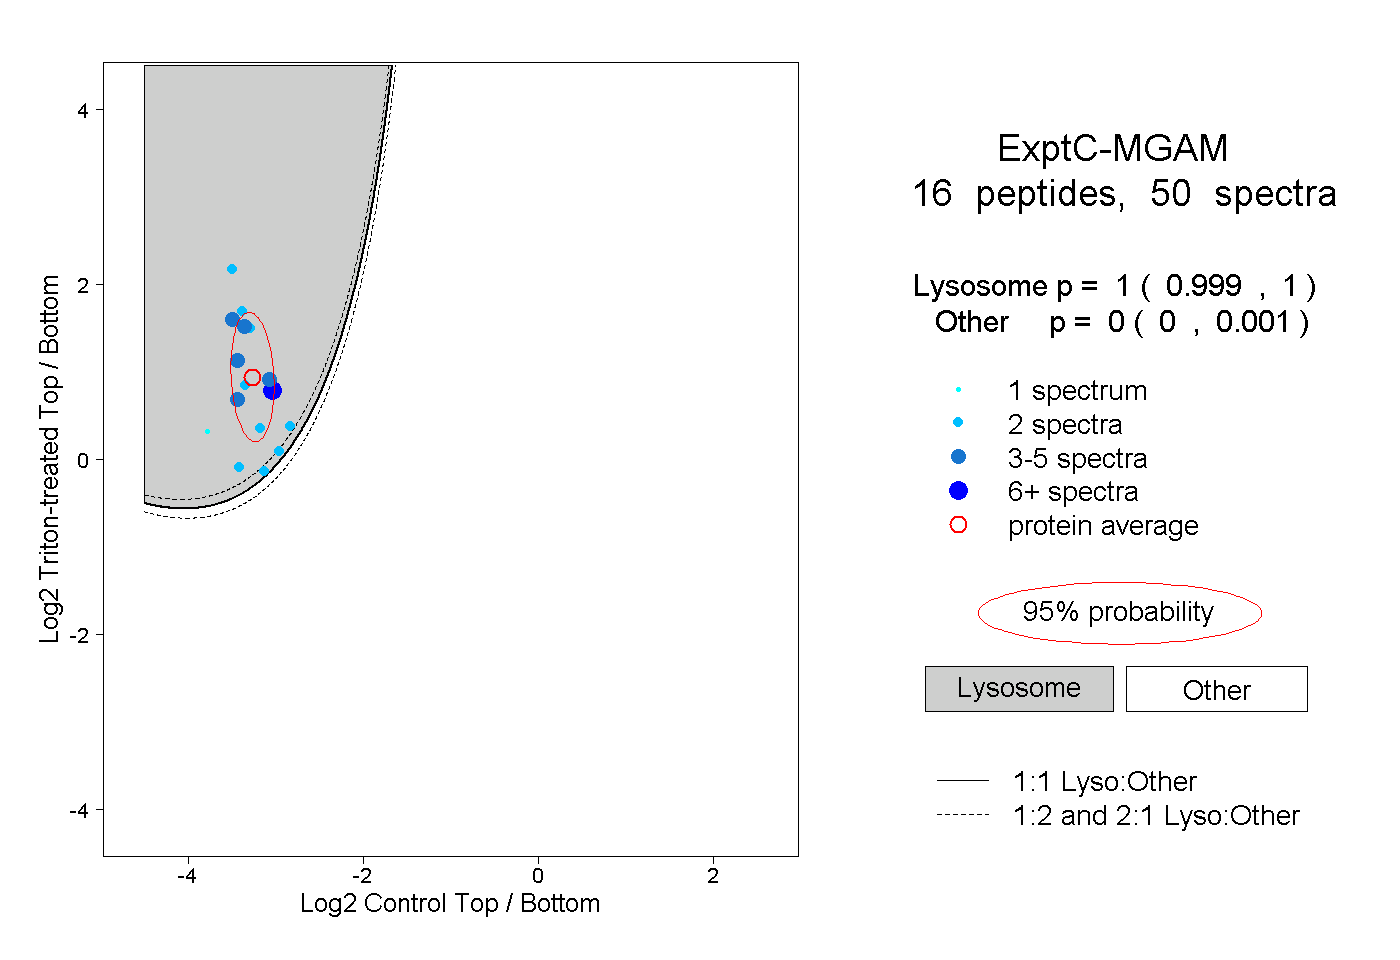
0.999 | 1.000
0.000 | 0.001
5peptides
spectra
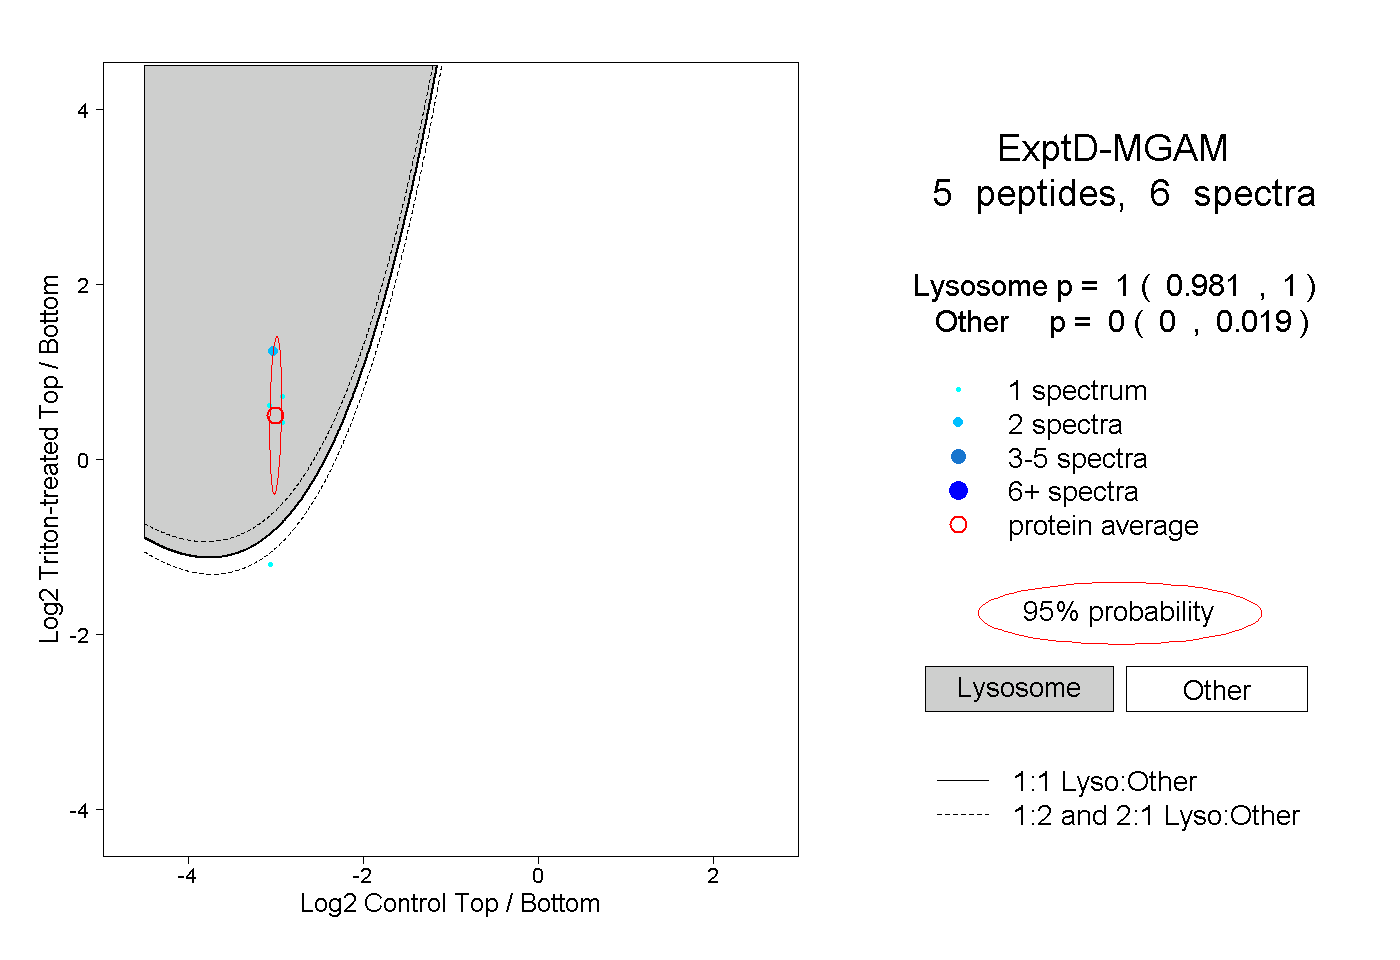
0.981 | 1.000
0.000 | 0.019