LGALS5
[ENSRNOP00000016897]
Main page
| | | Plot |
Mito |
Lyso |
|
Perox |
ER |
Golgi |
PM |
Cytosol |
Nucleus |
|
| Expt A |
 4
4
peptides |
20
spectra |
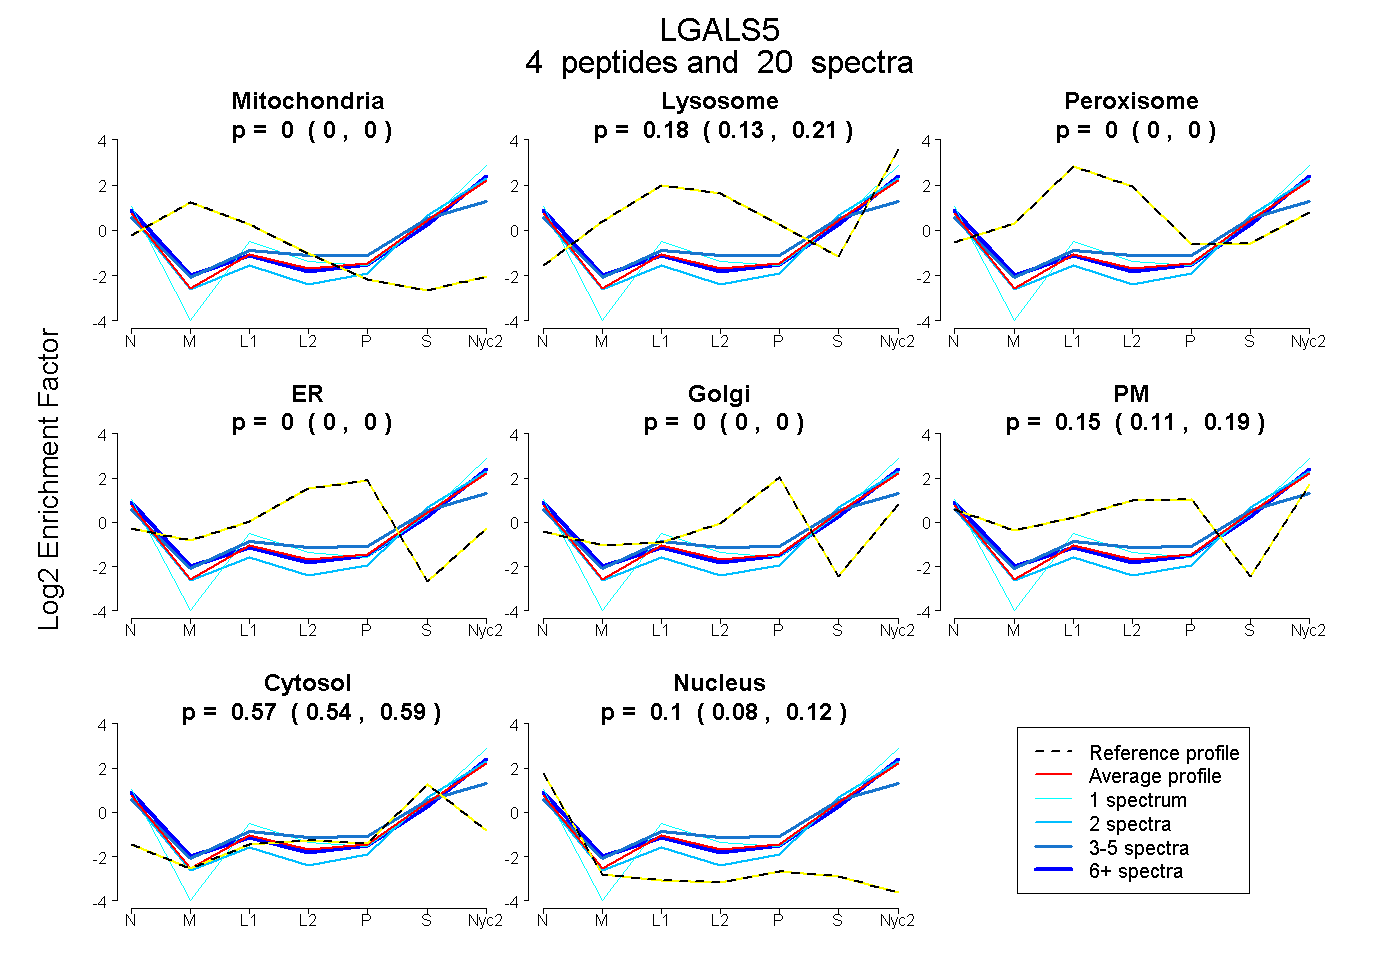 |
0.000
0.000 | 0.000 |
0.179
0.135 | 0.214 |
|
0.000
0.000 | 0.000 |
0.000
0.000 | 0.000 |
0.000
0.000 | 0.000 |
0.154
0.113 | 0.191 |
0.566
0.542 | 0.586 |
0.102
0.079 | 0.121 |
|
| | | Plot |
Mito |
|
Lyso or Perox |
|
ER |
Golgi |
PM |
Cytosol |
Nucleus |
|
| Expt B |
2
peptides |
4
spectra |
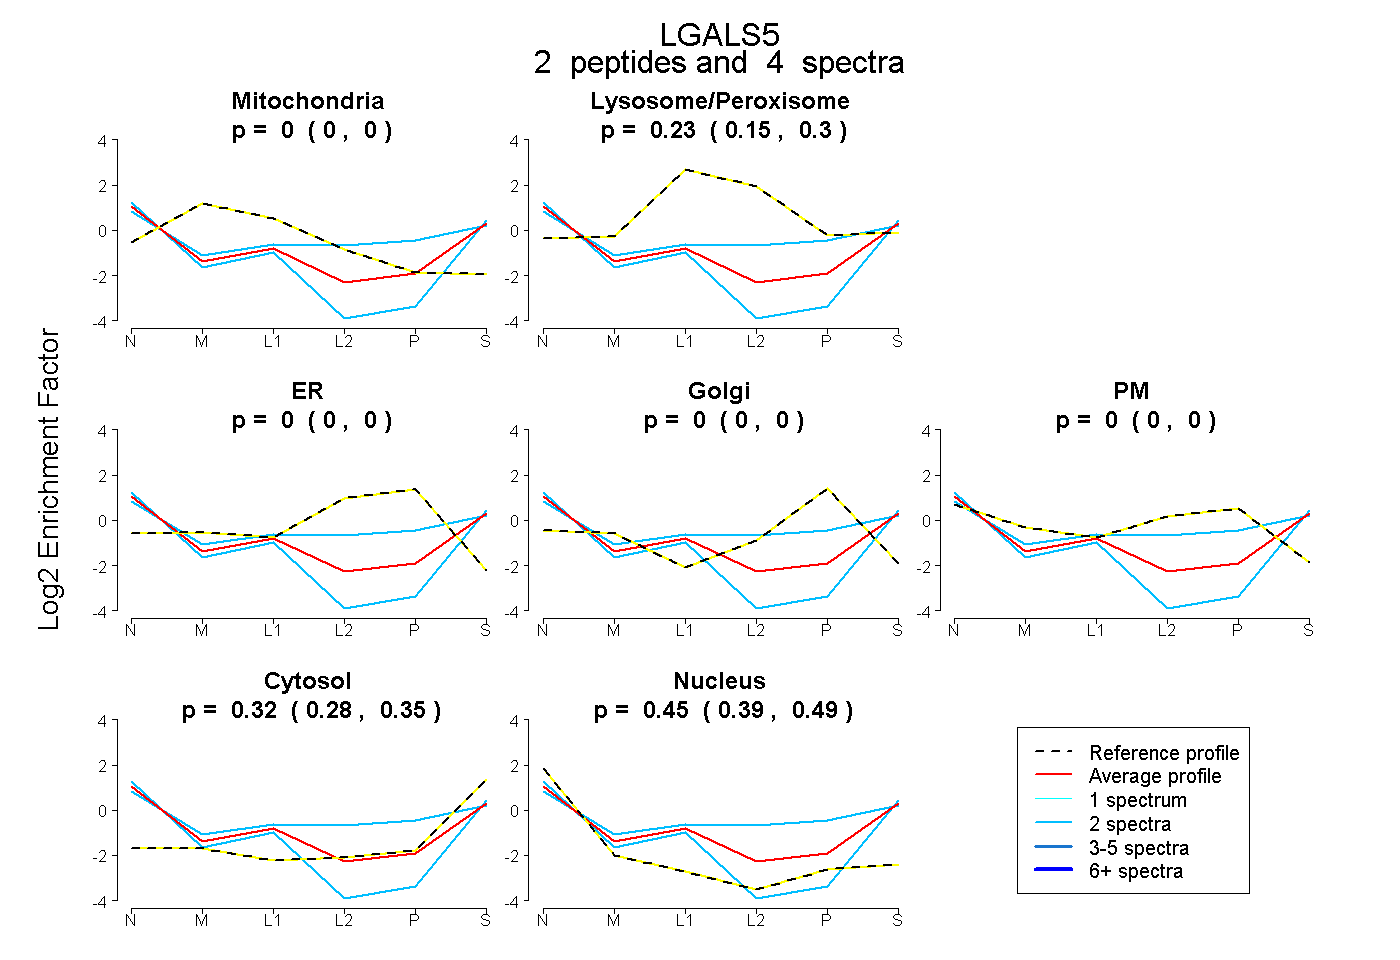 |
0.000
0.000 | 0.000 |
|
0.235
0.154 | 0.302 |
|
0.000
0.000 | 0.000 |
0.000
0.000 | 0.000 |
0.000
0.000 | 0.000 |
0.319
0.280 | 0.350 |
0.446
0.392 | 0.492 |
|
| 2 spectra, FQINLR |
0.000 |
|
0.029 |
|
0.000 |
0.000 |
0.000 |
0.386 |
0.585 |
|
| 2 spectra, CGGDIAFHLNPR |
0.000 |
|
0.263 |
|
0.000 |
0.000 |
0.297 |
0.275 |
0.165 |
|
| | | Plot |
|
Lyso |
|
|
|
|
|
|
|
Other |
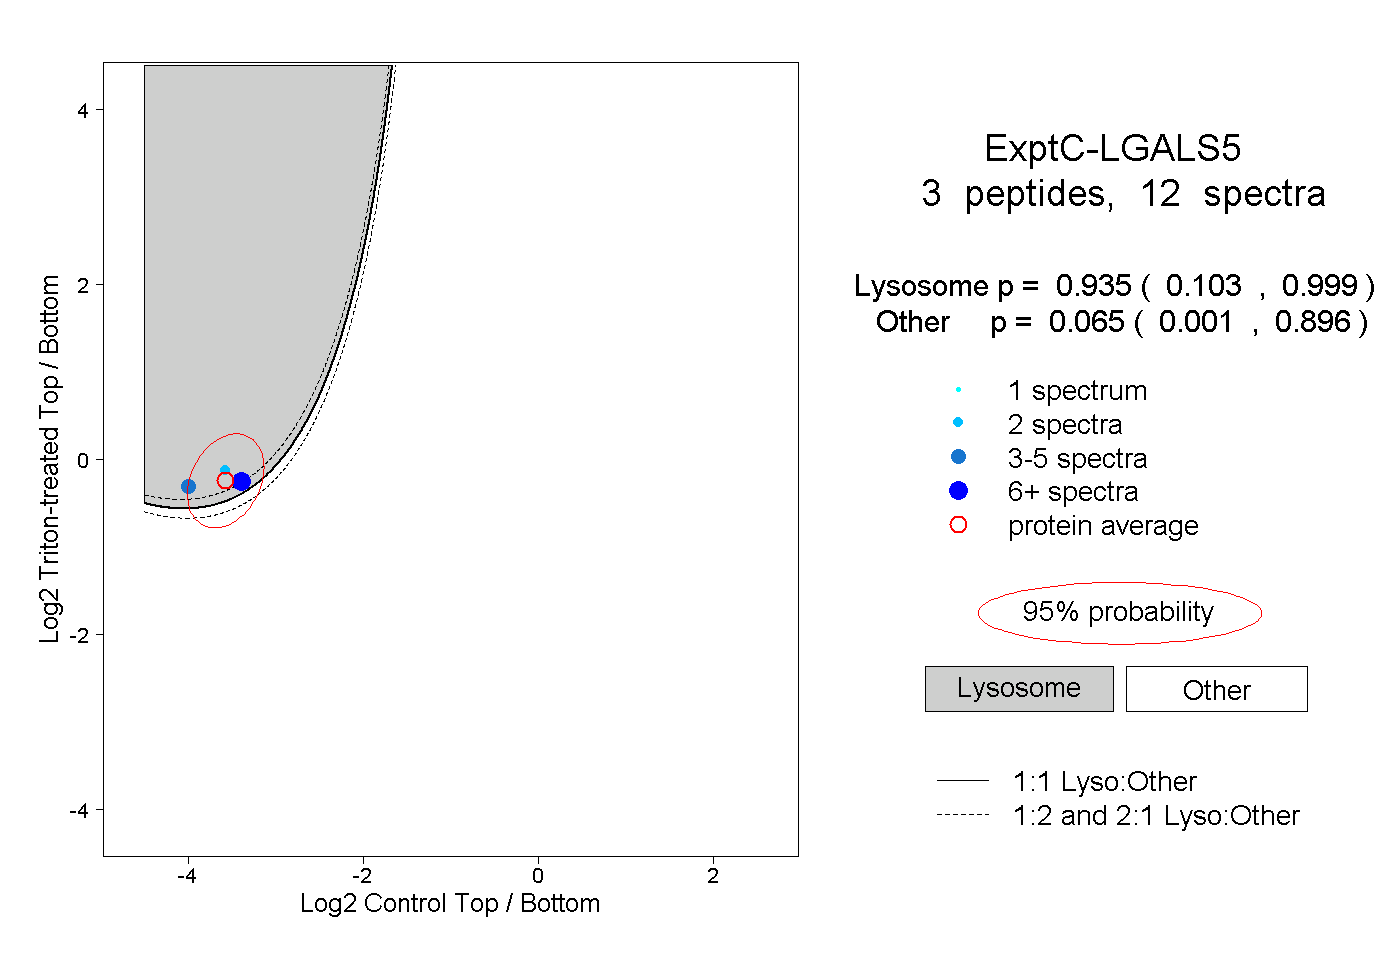
| Expt C |
3
peptides |
12
spectra |
 |
|
0.935
0.103 | 0.999 |
|
|
|
|
|
|
|
0.065
0.001 | 0.896 |