 15
15peptides
spectra
0.000 | 0.000
0.000 | 0.000
0.000 | 0.000
0.000 | 0.000
0.000 | 0.000
0.000 | 0.000
0.910 | 0.920
0.079 | 0.089
| Plot | Mito | Lyso | Perox | ER | Golgi | PM | Cytosol | Nucleus | |||||
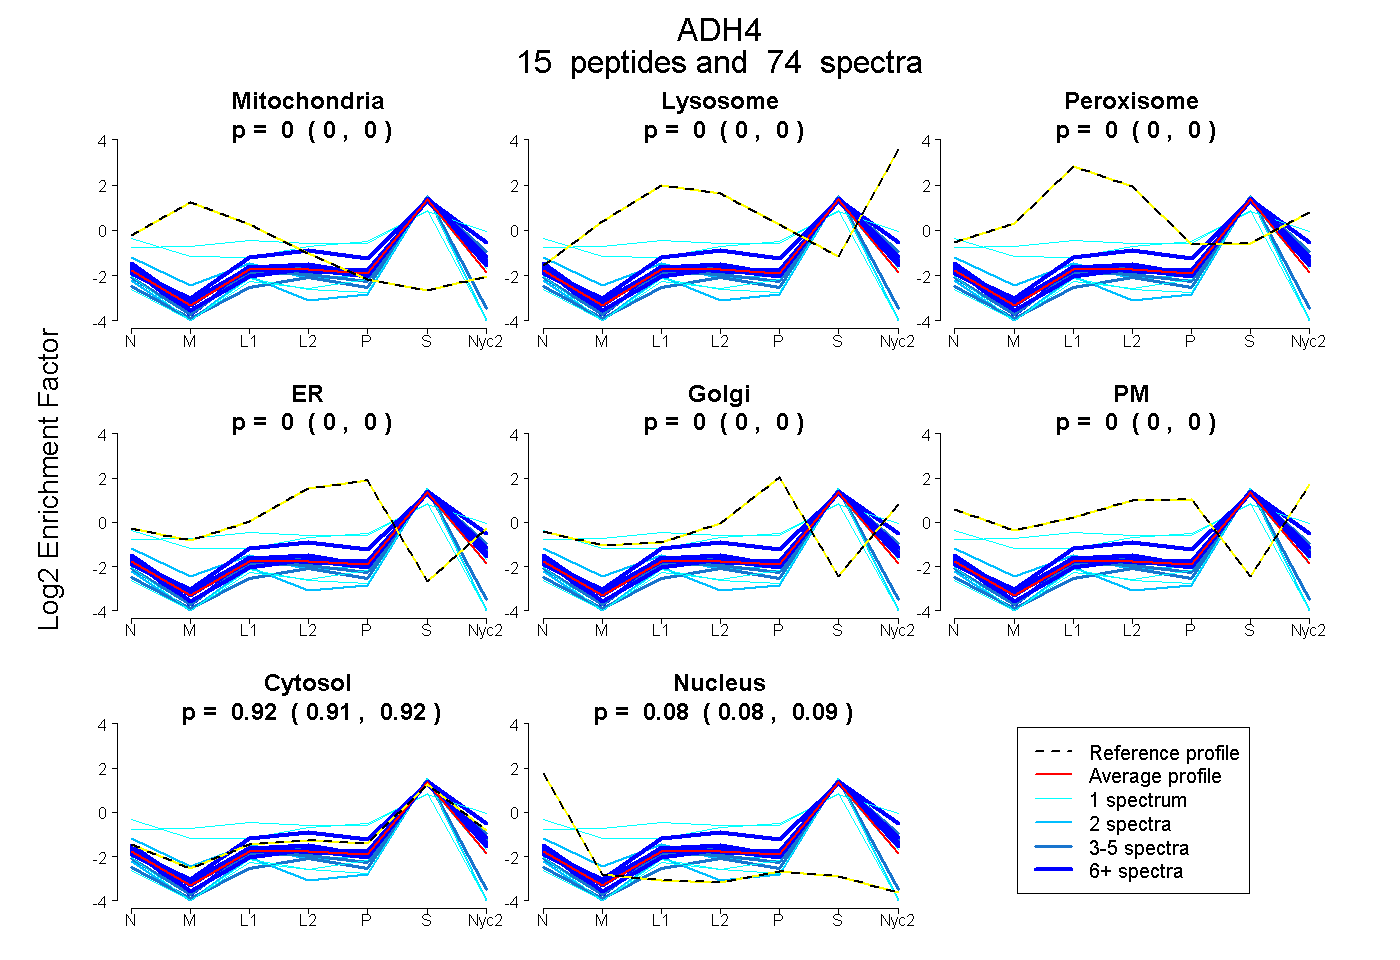
| Expt A |
15 peptides |
74 spectra |
|
0.000 0.000 | 0.000 |
0.000 0.000 | 0.000 |
0.000 0.000 | 0.000 |
0.000 0.000 | 0.000 |
0.000 0.000 | 0.000 |
0.000 0.000 | 0.000 |
0.915 0.910 | 0.920 |
0.085 0.079 | 0.089 |
| 4 spectra, INDAIDLMNQGK | 0.000 | 0.000 | 0.000 | 0.000 | 0.000 | 0.000 | 0.983 | 0.017 | ||
| 8 spectra, VDEMNISTVDMILGR | 0.000 | 0.000 | 0.000 | 0.000 | 0.000 | 0.000 | 1.000 | 0.000 | ||
| 1 spectrum, VIATCVCPTDINATNPK | 0.000 | 0.000 | 0.012 | 0.000 | 0.000 | 0.287 | 0.700 | 0.000 | ||
| 15 spectra, VDDEANLER | 0.000 | 0.000 | 0.000 | 0.000 | 0.000 | 0.000 | 0.913 | 0.087 | ||
| 12 spectra, YPTIDQELMEDR | 0.000 | 0.000 | 0.000 | 0.000 | 0.000 | 0.000 | 0.972 | 0.028 | ||
| 6 spectra, VIPFFAPQCK | 0.000 | 0.000 | 0.000 | 0.005 | 0.000 | 0.000 | 0.995 | 0.000 | ||
| 1 spectrum, SVDSVPNLVTDYK | 0.000 | 0.000 | 0.000 | 0.000 | 0.000 | 0.000 | 0.891 | 0.109 | ||
| 1 spectrum, TDSPLCIEEIEVSPPK | 0.366 | 0.000 | 0.000 | 0.028 | 0.000 | 0.000 | 0.590 | 0.016 | ||
| 2 spectra, AAIAWK | 0.000 | 0.000 | 0.000 | 0.000 | 0.000 | 0.000 | 0.865 | 0.135 | ||
| 6 spectra, ALGATDCLNPR | 0.000 | 0.000 | 0.000 | 0.000 | 0.000 | 0.000 | 0.949 | 0.051 | ||
| 1 spectrum, VCLIGCGFTSGYGAAINTAK | 0.000 | 0.000 | 0.000 | 0.000 | 0.000 | 0.000 | 0.774 | 0.226 | ||
| 3 spectra, LCLSPLTNLCGK | 0.000 | 0.000 | 0.000 | 0.000 | 0.000 | 0.000 | 0.812 | 0.188 | ||
| 4 spectra, IIAIDINSEK | 0.000 | 0.000 | 0.000 | 0.000 | 0.000 | 0.000 | 0.965 | 0.035 | ||
| 8 spectra, GTFFGGWK | 0.000 | 0.000 | 0.000 | 0.000 | 0.000 | 0.000 | 0.945 | 0.055 | ||
| 2 spectra, AAVDCTVVGWGSCTVVGAK | 0.000 | 0.000 | 0.000 | 0.000 | 0.000 | 0.000 | 0.724 | 0.276 |
| Plot | Mito | Lyso or Perox | ER | Golgi | PM | Cytosol | Nucleus | ||||||
| Expt B |
7 peptides |
17 spectra |
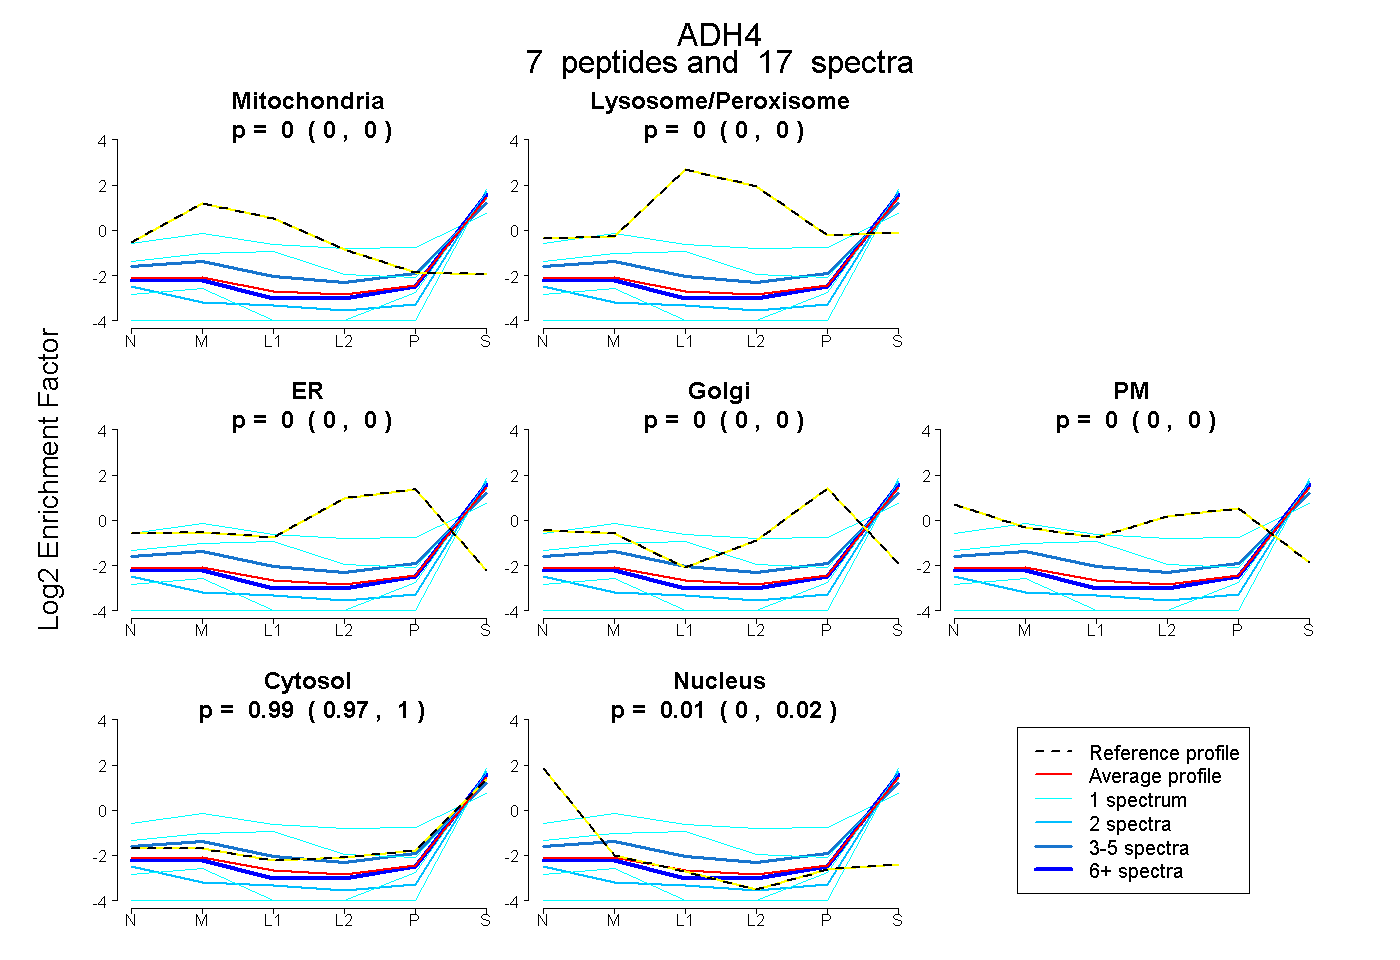 |
0.000 0.000 | 0.000 |
0.000 0.000 | 0.000 |
0.000 0.000 | 0.000 |
0.000 0.000 | 0.000 |
0.000 0.000 | 0.000 |
0.992 0.970 | 1.000 |
0.008 0.000 | 0.025 |
|||
| Plot | Lyso | Other | |||||||||||
| Expt C |
9 peptides |
44 spectra |
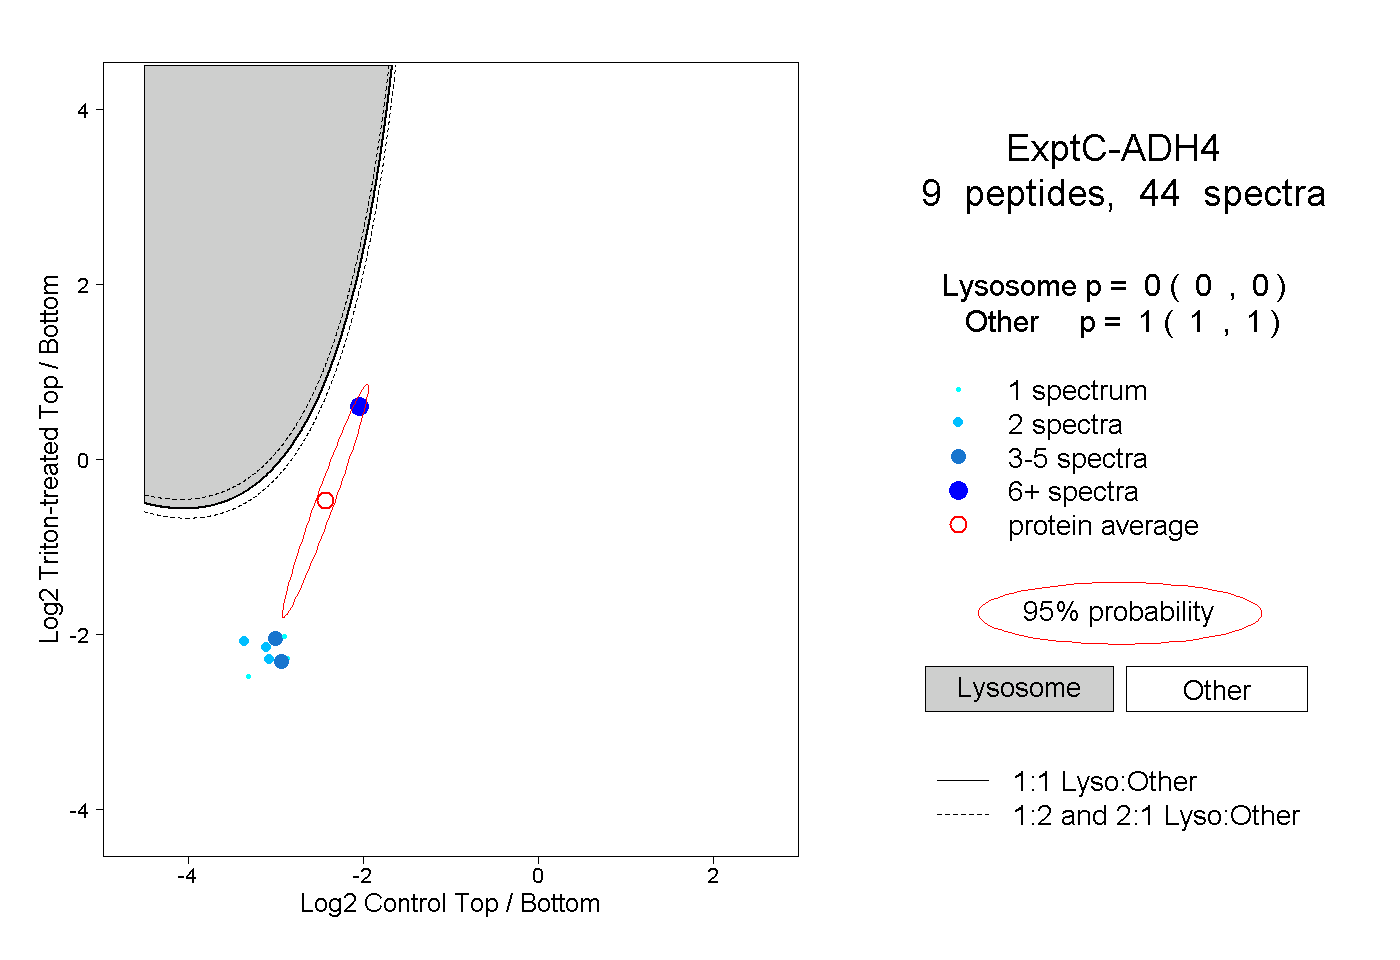 |
0.000 0.000 | 0.000 |
1.000 1.000 | 1.000 |
||||||||
| Plot | Lyso | Other | |||||||||||
| Expt D |
1 peptide |
2 spectra |
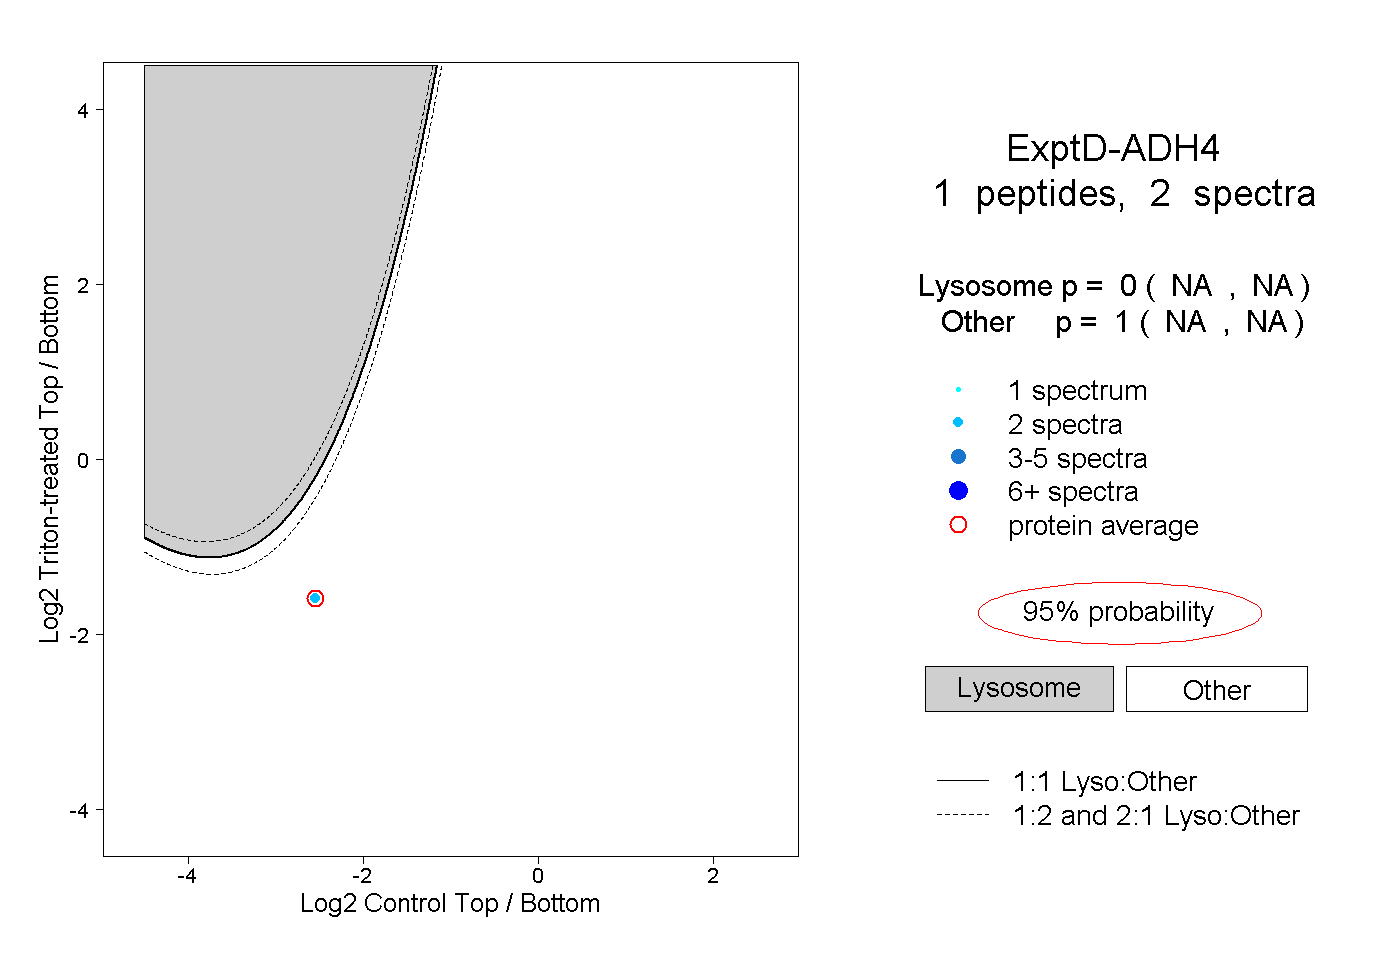 |
0.000 NA | NA |
1.000 NA | NA |