27
27peptides
spectra
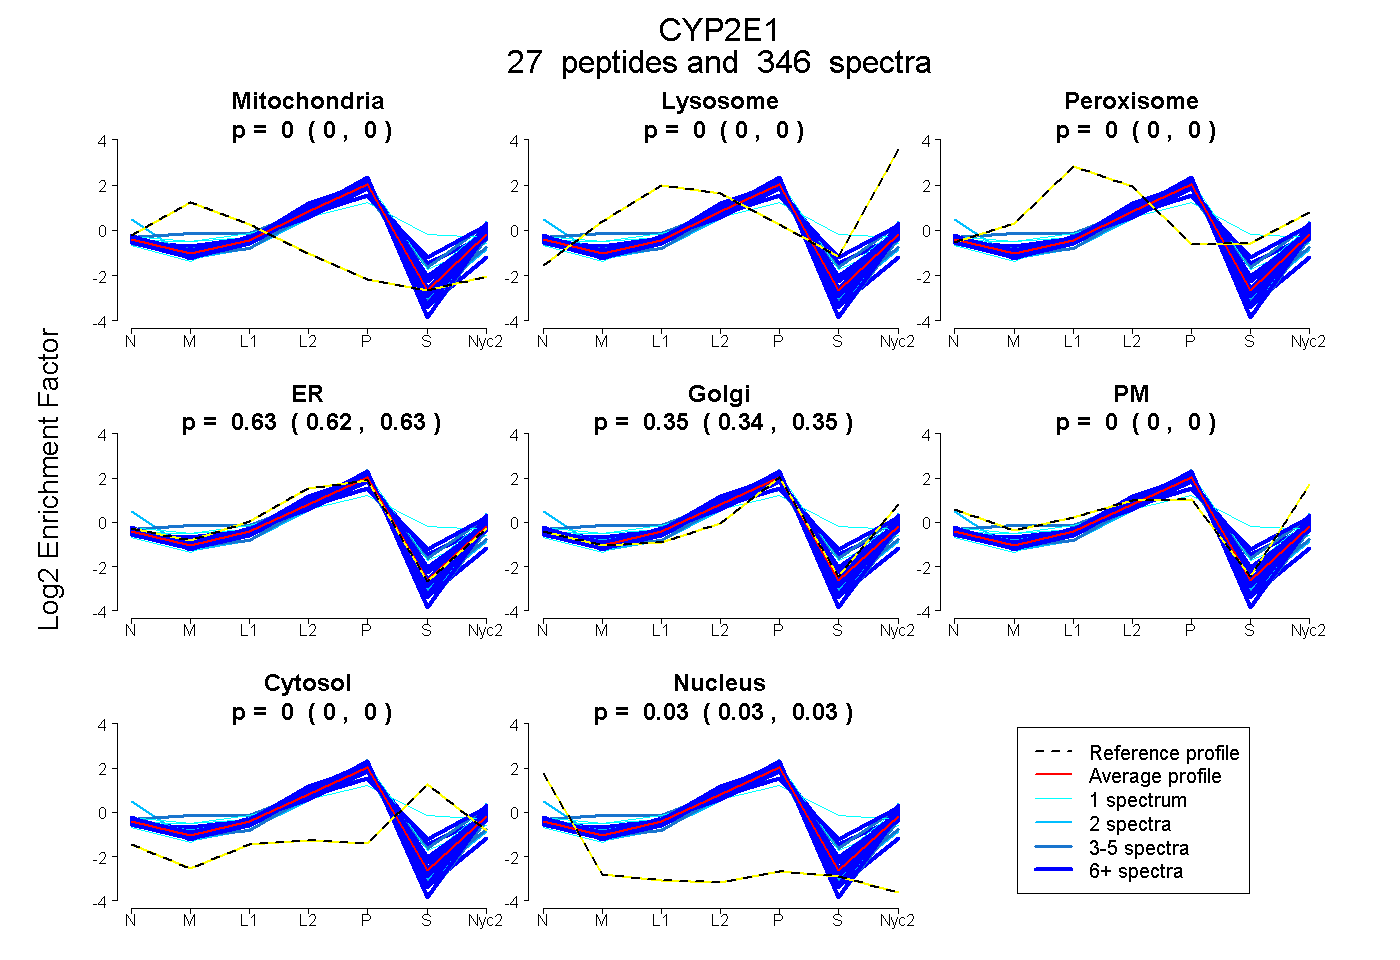
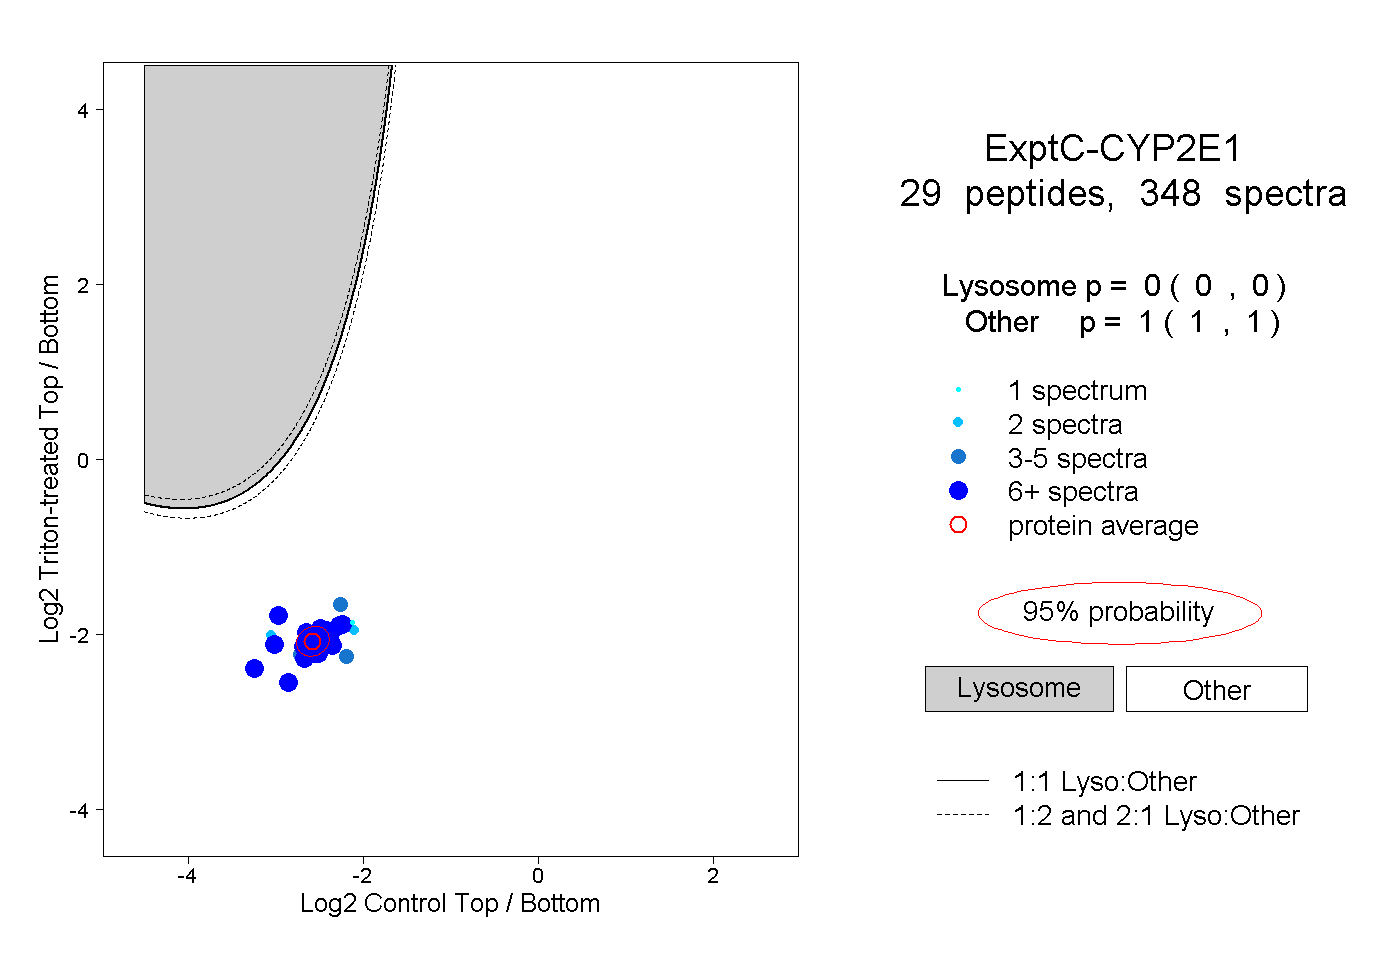
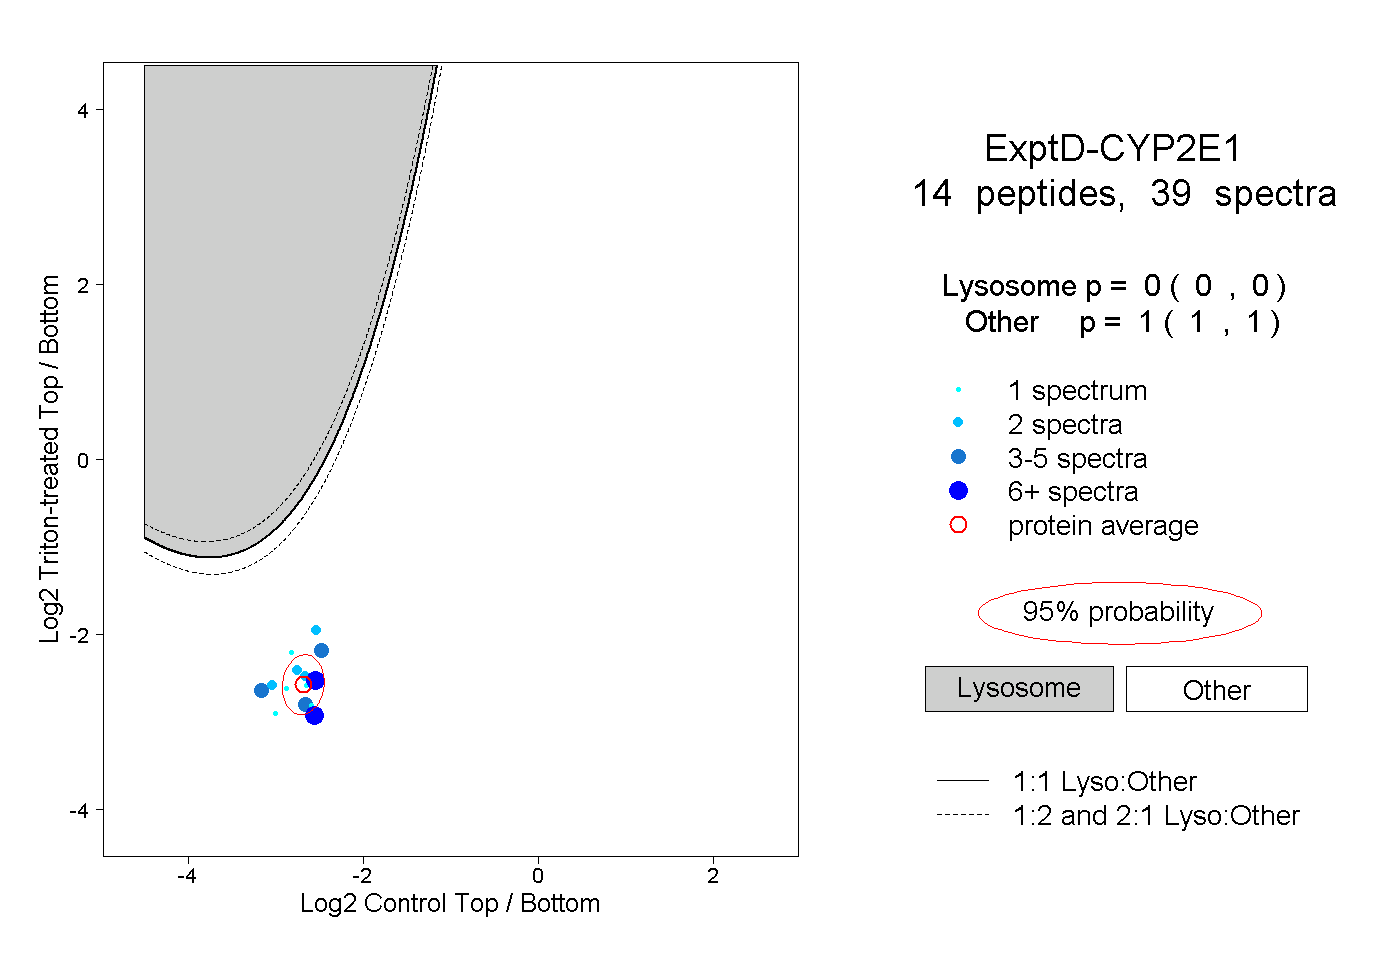
0.000 | 0.000
0.000 | 0.000
0.000 | 0.000
0.625 | 0.629
0.342 | 0.348
0.000 | 0.000
0.000 | 0.000
0.027 | 0.028
23peptides
spectra
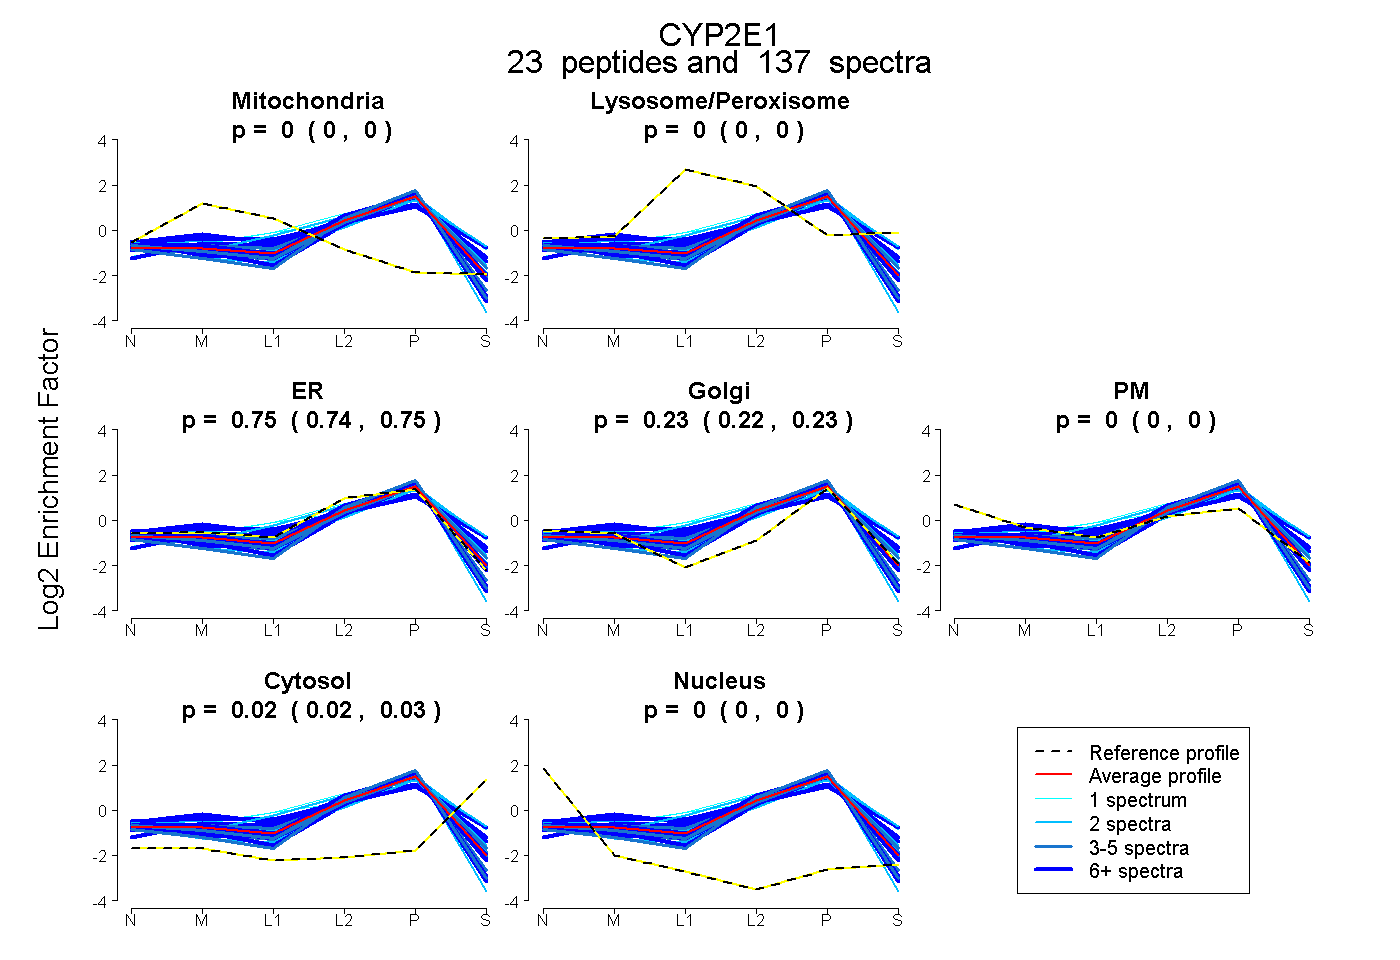
0.000 | 0.000
0.000 | 0.000
0.742 | 0.750
0.223 | 0.235
0.000 | 0.000
0.020 | 0.027
0.000 | 0.000