 4
4peptides
spectra
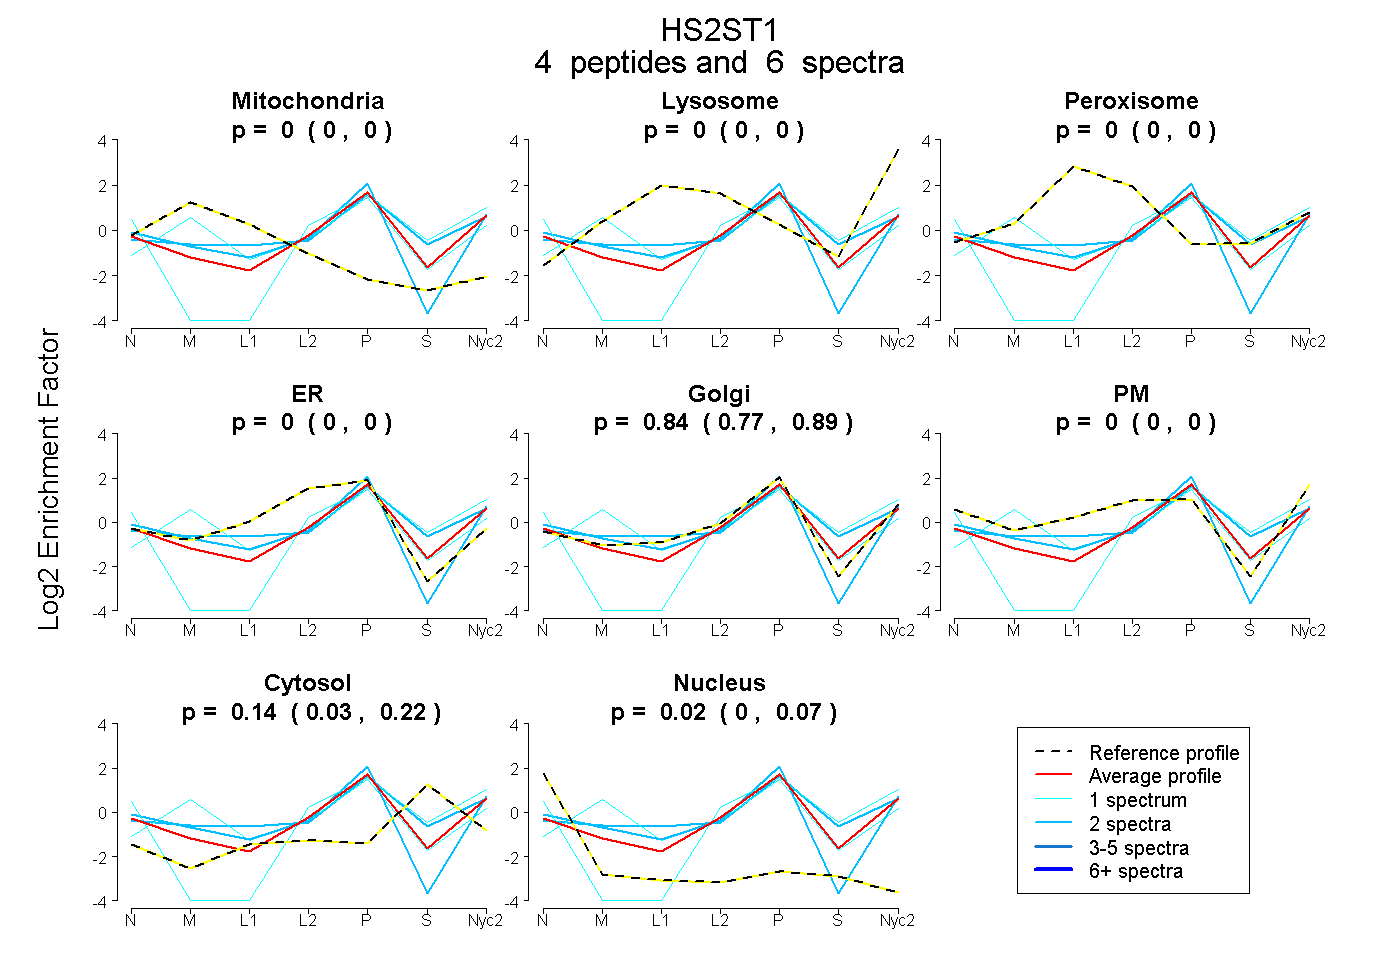
0.000 | 0.000
0.000 | 0.000
0.000 | 0.000
0.000 | 0.000
0.765 | 0.892
0.000 | 0.004
0.026 | 0.220
0.000 | 0.068
| Plot | Mito | Lyso | Perox | ER | Golgi | PM | Cytosol | Nucleus | |||||
| Expt A |
4 peptides |
6 spectra |
|
0.000 0.000 | 0.000 |
0.000 0.000 | 0.000 |
0.000 0.000 | 0.000 |
0.000 0.000 | 0.000 |
0.839 0.765 | 0.892 |
0.000 0.000 | 0.004 |
0.141 0.026 | 0.220 |
0.020 0.000 | 0.068 |
| 2 spectra, GATDLYR | 0.000 | 0.054 | 0.056 | 0.000 | 0.665 | 0.000 | 0.225 | 0.000 | ||
| 1 spectrum, HTMDGPR | 0.200 | 0.029 | 0.000 | 0.000 | 0.732 | 0.000 | 0.039 | 0.000 | ||
| 1 spectrum, TASTSFTNIAYDLCAK | 0.000 | 0.000 | 0.000 | 0.000 | 0.583 | 0.000 | 0.360 | 0.058 | ||
| 2 spectra, LVSYYYFLR | 0.000 | 0.000 | 0.000 | 0.000 | 0.958 | 0.000 | 0.000 | 0.042 |
| Plot | Lyso | Other | |||||||||||
| Expt C |
2 peptides |
5 spectra |
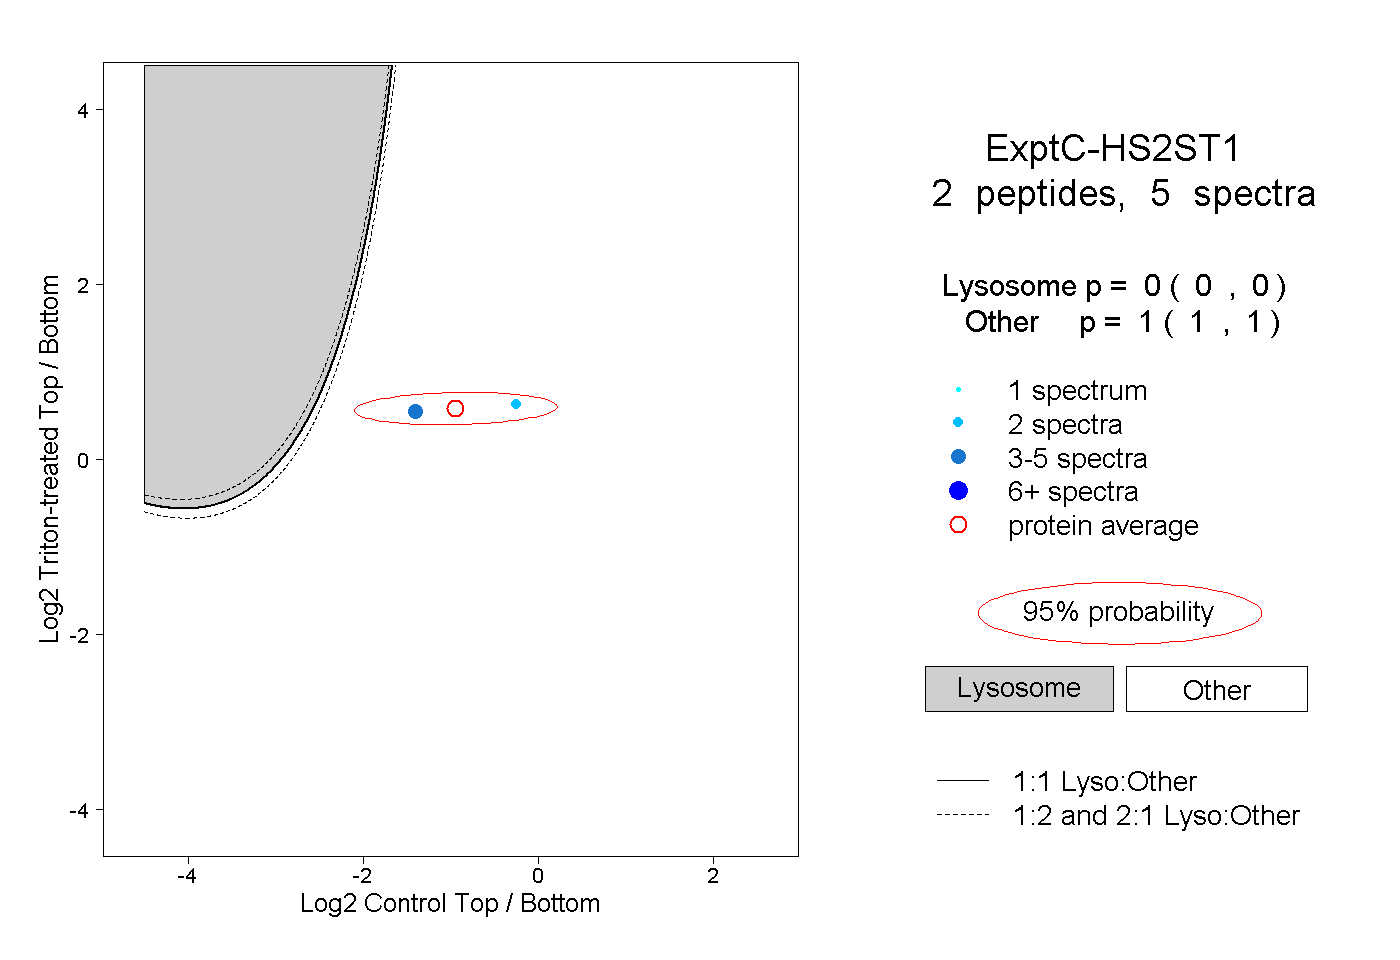 |
0.000 0.000 | 0.000 |
1.000 1.000 | 1.000 |