 10
10peptides
spectra
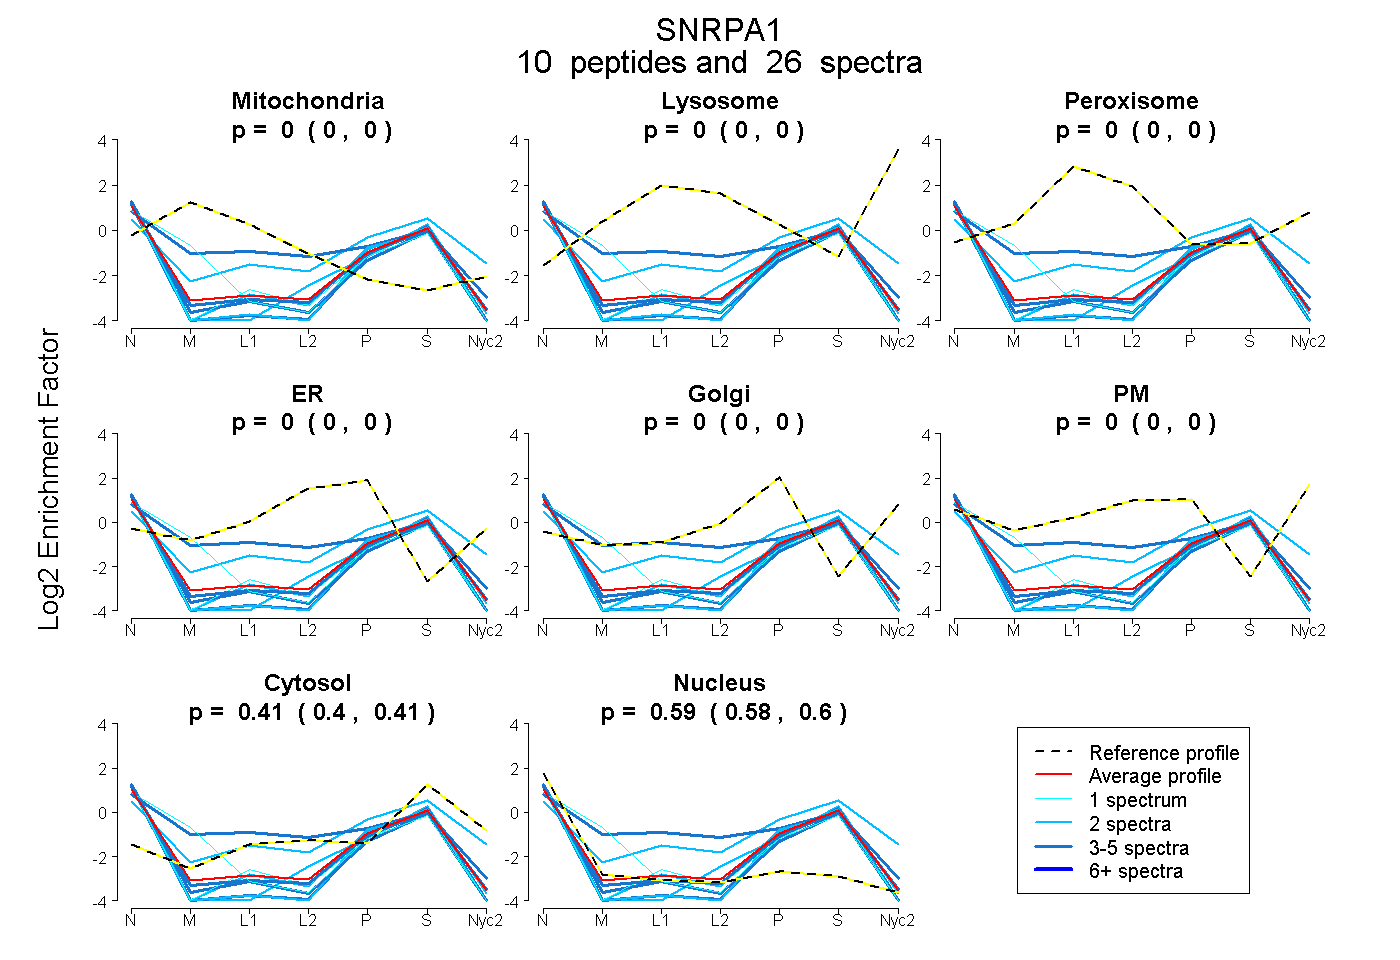
0.000 | 0.000
0.000 | 0.000
0.000 | 0.000
0.000 | 0.000
0.000 | 0.000
0.000 | 0.000
0.396 | 0.414
0.583 | 0.602
4peptides
spectra
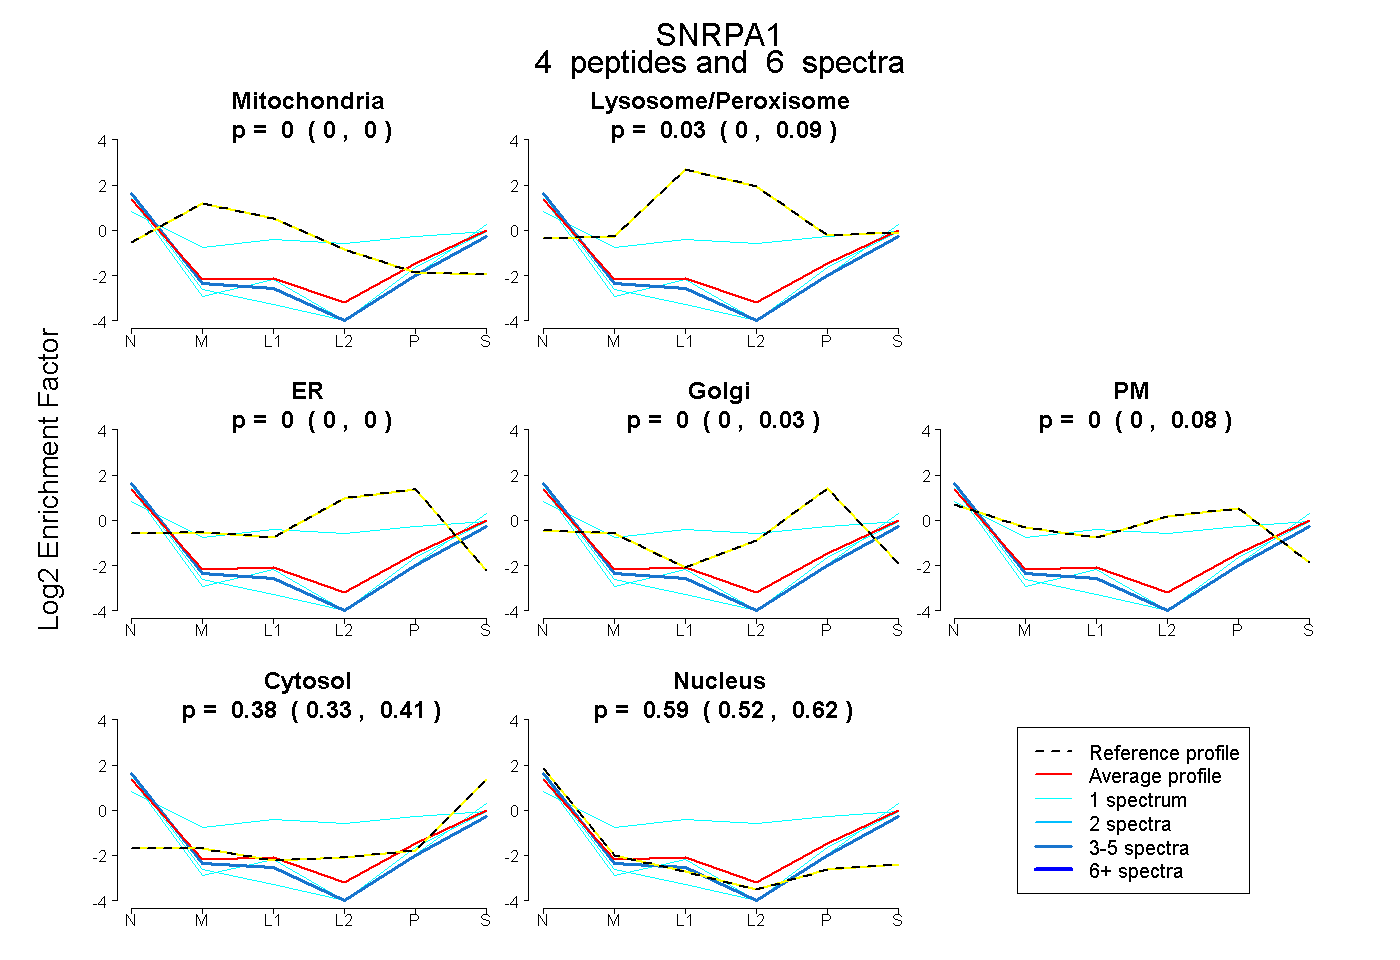
0.000 | 0.000
0.000 | 0.091
0.000 | 0.000
0.000 | 0.028
0.000 | 0.078
0.326 | 0.405
0.517 | 0.616
3peptides
spectra
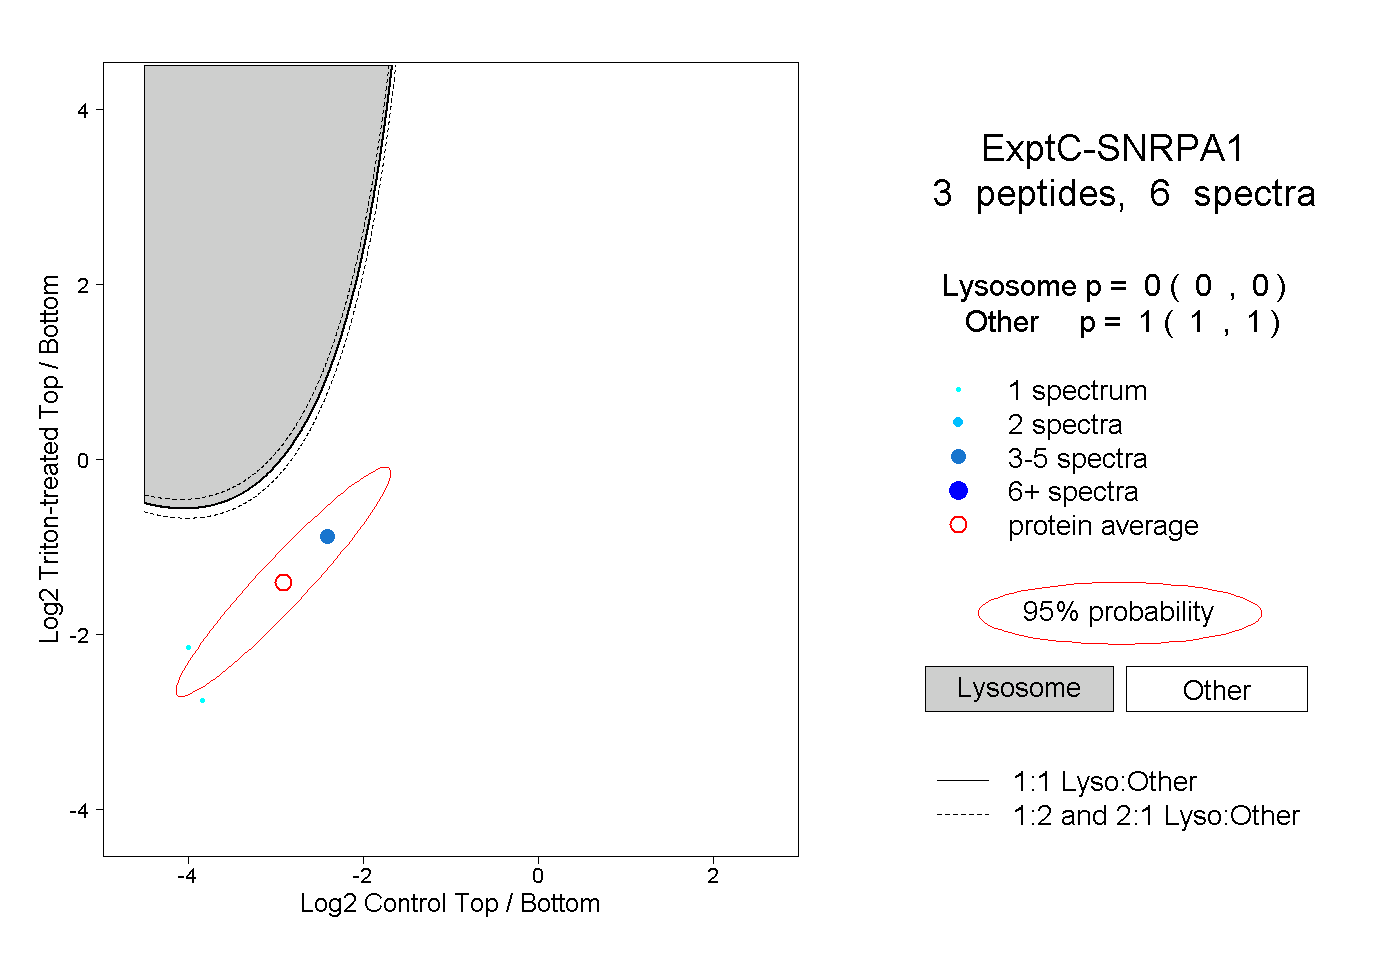
0.000 | 0.000
1.000 | 1.000