 2
2peptides
spectra
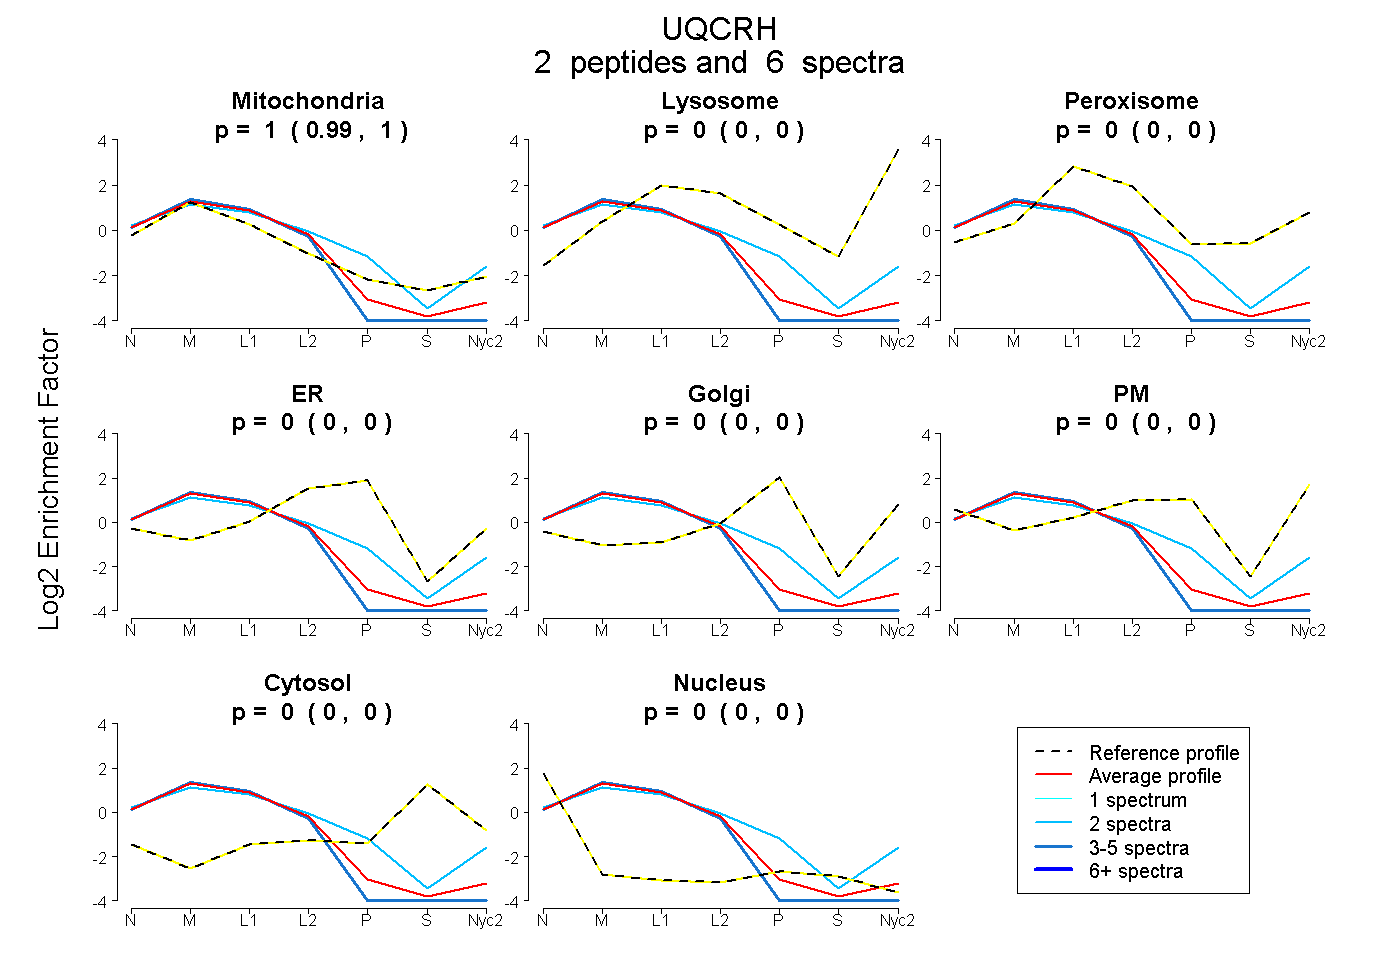
0.994 | 1.000
0.000 | 0.000
0.000 | 0.000
0.000 | 0.000
0.000 | 0.000
0.000 | 0.000
0.000 | 0.000
0.000 | 0.003
2peptides
spectra
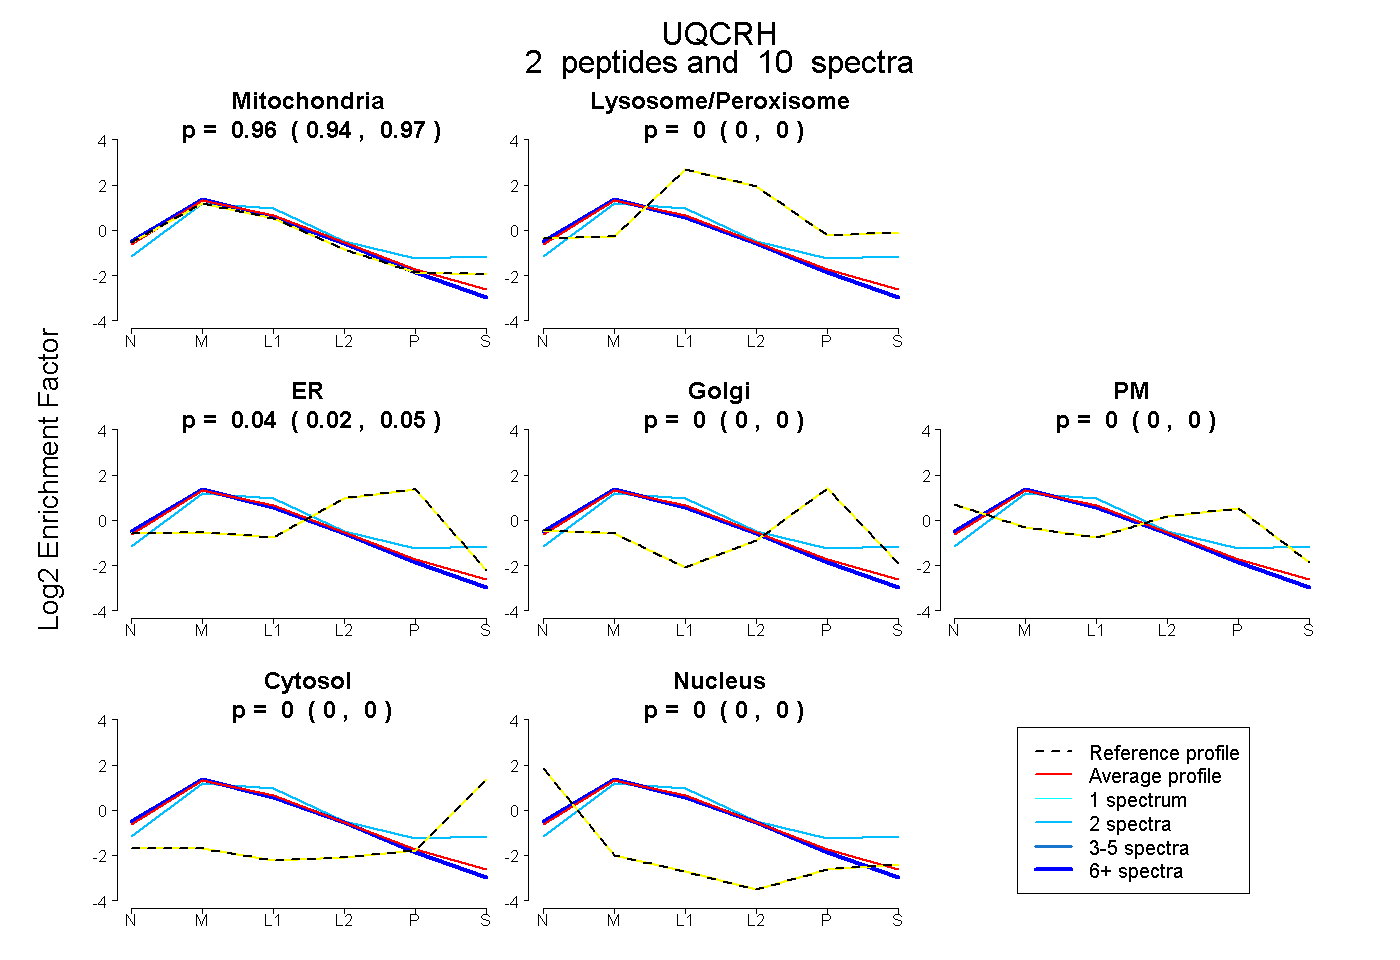
0.943 | 0.974
0.000 | 0.000
0.023 | 0.054
0.000 | 0.000
0.000 | 0.000
0.000 | 0.000
0.000 | 0.000
3peptides
spectra

0.000 | 0.000
1.000 | 1.000
1peptide
spectra

NA | NA
NA | NA