 2
2peptides
spectra
0.000 | 0.000
0.000 | 0.000
0.000 | 0.000
0.109 | 0.215
0.000 | 0.048
0.000 | 0.000
0.094 | 0.163
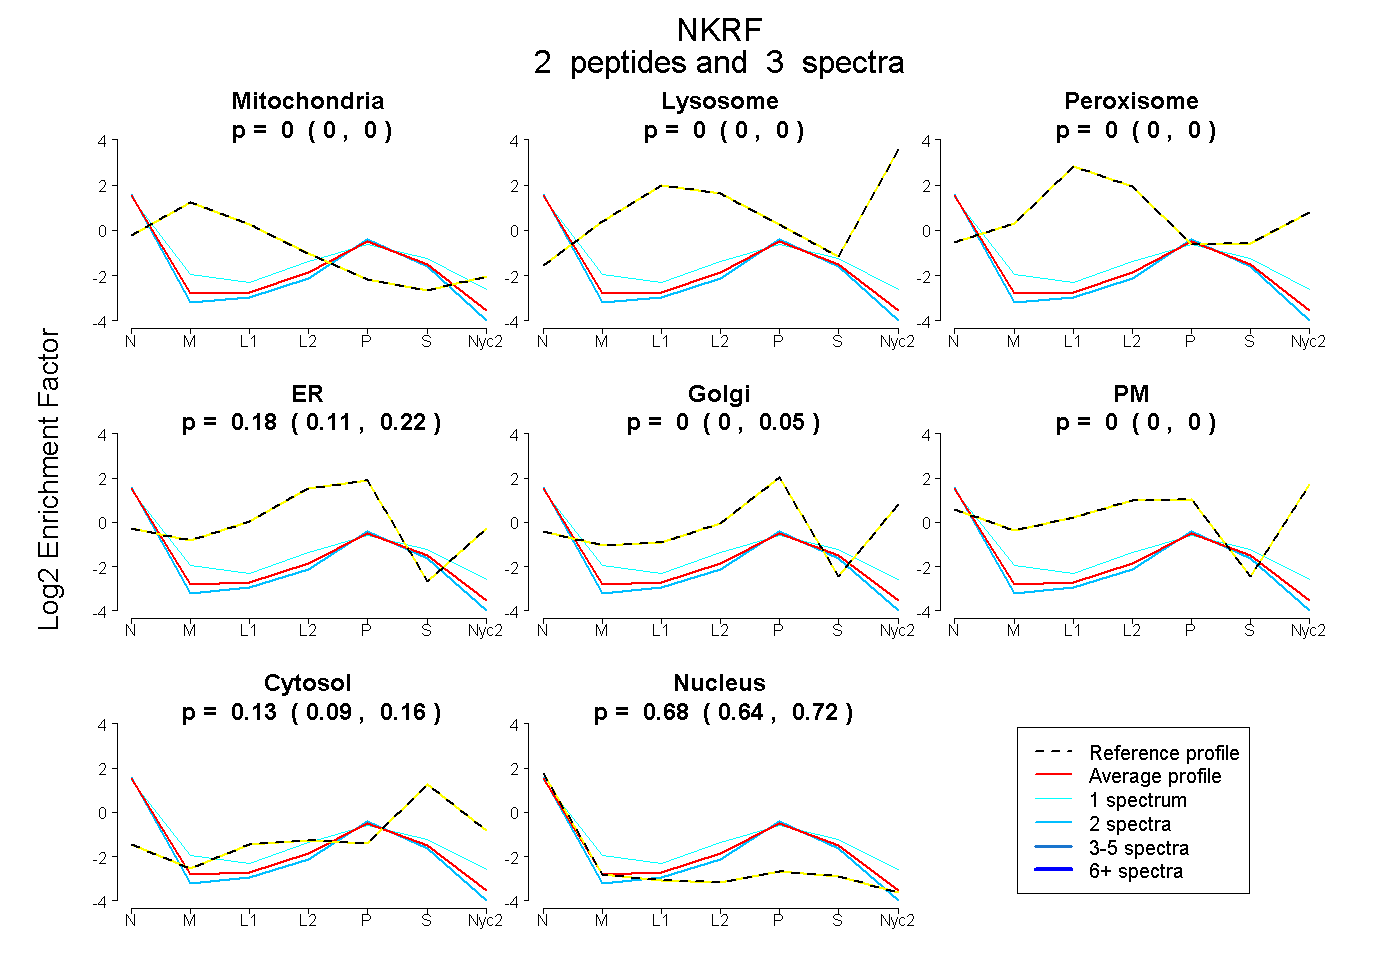
0.638 | 0.721
| Plot | Mito | Lyso | Perox | ER | Golgi | PM | Cytosol | Nucleus | |||||
| Expt A |
2 peptides |
3 spectra |
|
0.000 0.000 | 0.000 |
0.000 0.000 | 0.000 |
0.000 0.000 | 0.000 |
0.183 0.109 | 0.215 |
0.000 0.000 | 0.048 |
0.000 0.000 | 0.000 |
0.133 0.094 | 0.163 |
0.684 0.638 | 0.721 |
| 2 spectra, FHVRPR | 0.000 | 0.000 | 0.000 | 0.142 | 0.000 | 0.000 | 0.103 | 0.755 | ||
| 1 spectrum, YEAAGEAVK | 0.000 | 0.000 | 0.000 | 0.264 | 0.000 | 0.000 | 0.193 | 0.543 |