7
7peptides
spectra
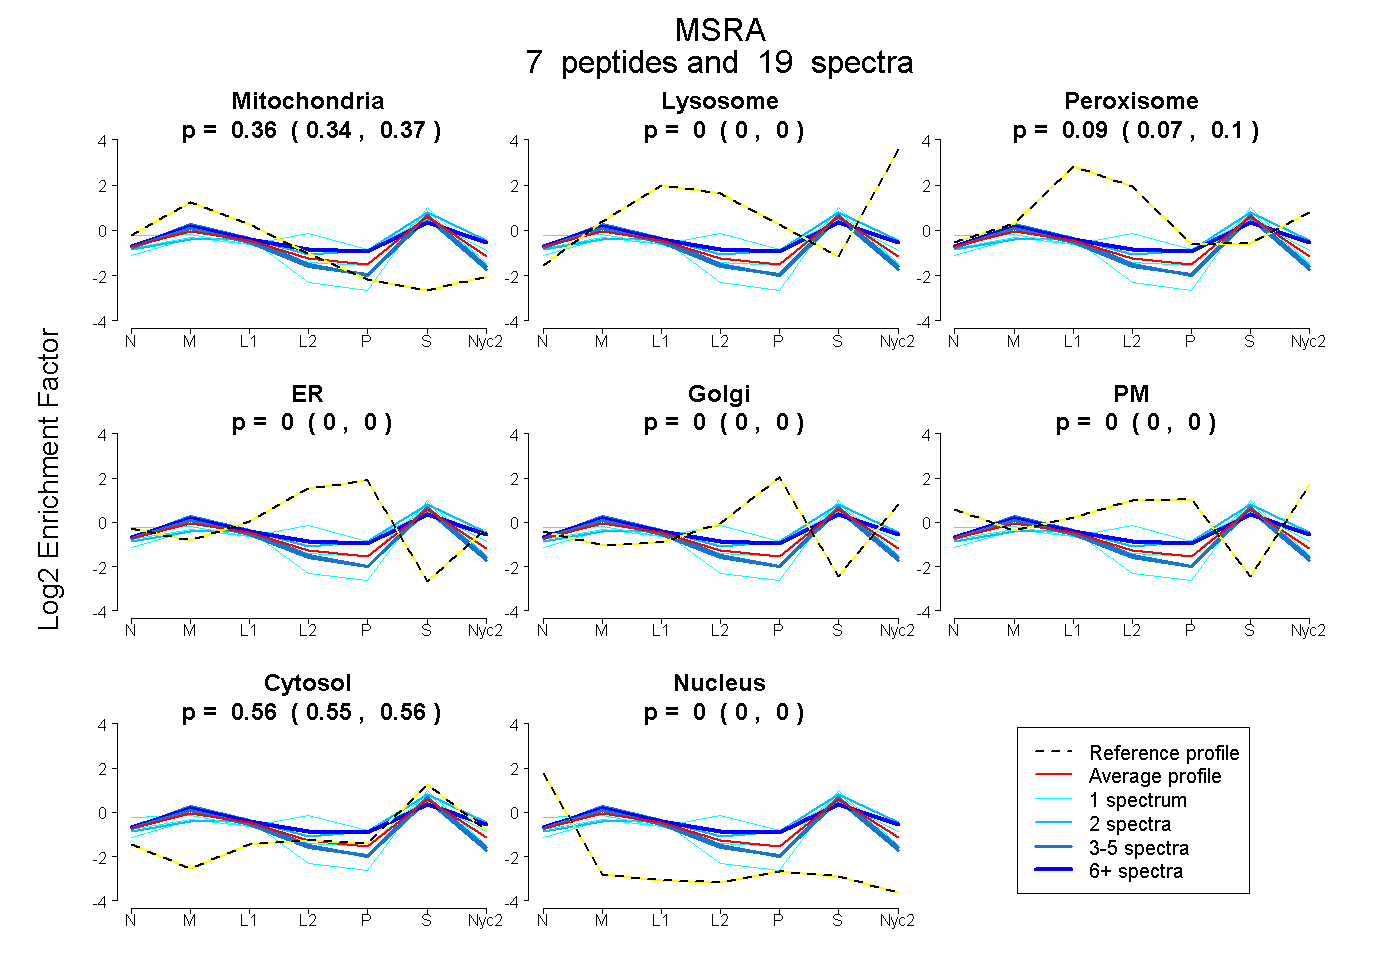
0.343 | 0.370
0.000 | 0.000
0.070 | 0.101
0.000 | 0.000
0.000 | 0.000
0.000 | 0.000
0.547 | 0.563
0.000 | 0.000
4peptides
spectra
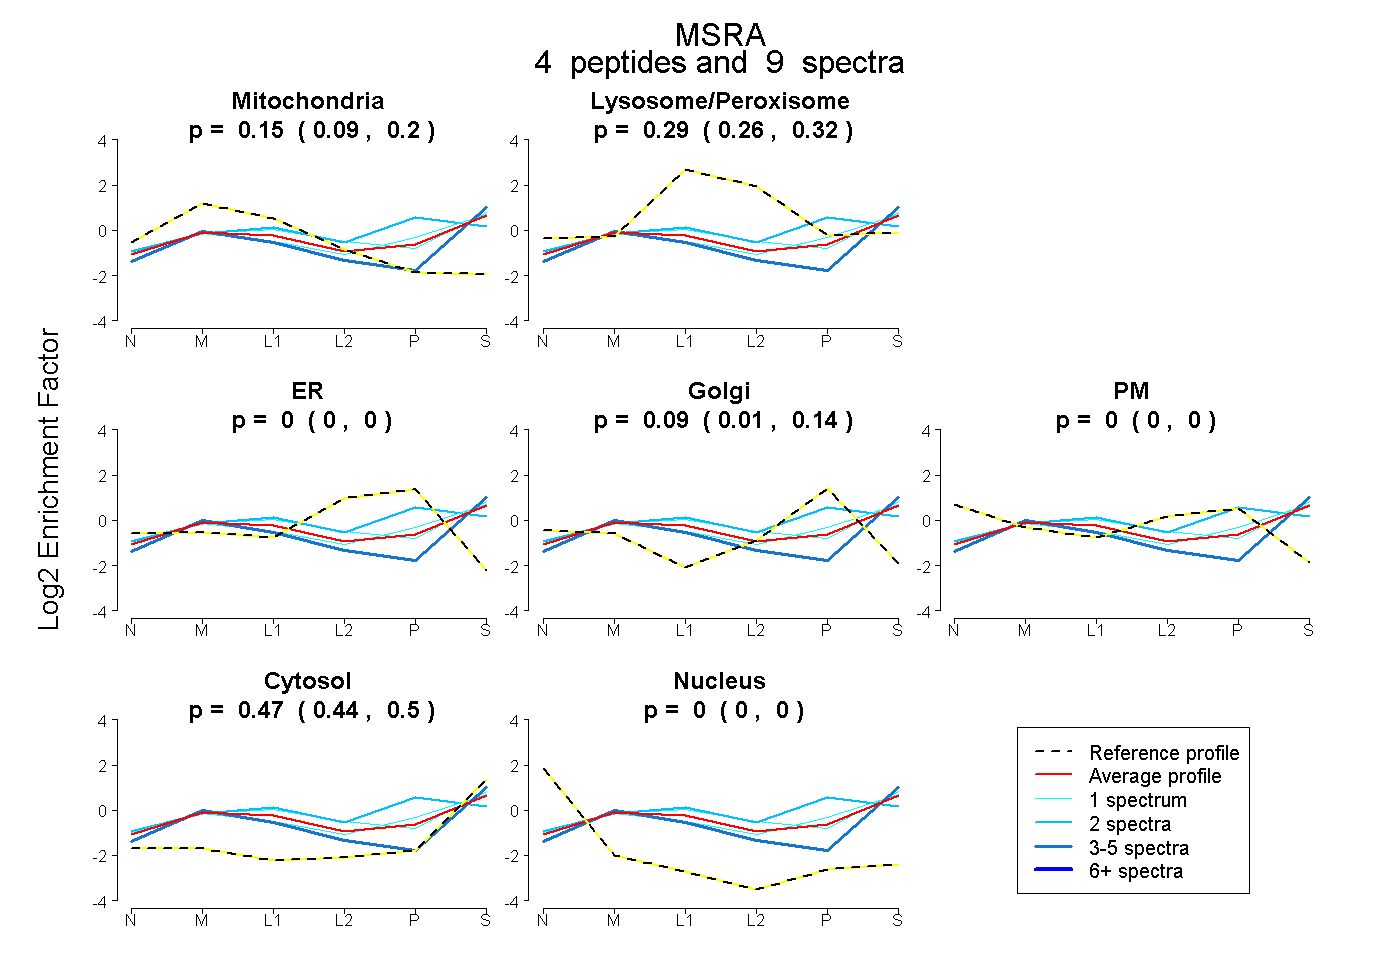
0.087 | 0.203
0.260 | 0.322
0.000 | 0.000
0.012 | 0.145
0.000 | 0.000
0.435 | 0.503
0.000 | 0.000