 7
7peptides
spectra
0.343 | 0.370
0.000 | 0.000
0.070 | 0.101
0.000 | 0.000
0.000 | 0.000
0.000 | 0.000
0.547 | 0.563
0.000 | 0.000
| Plot | Mito | Lyso | Perox | ER | Golgi | PM | Cytosol | Nucleus | |||||
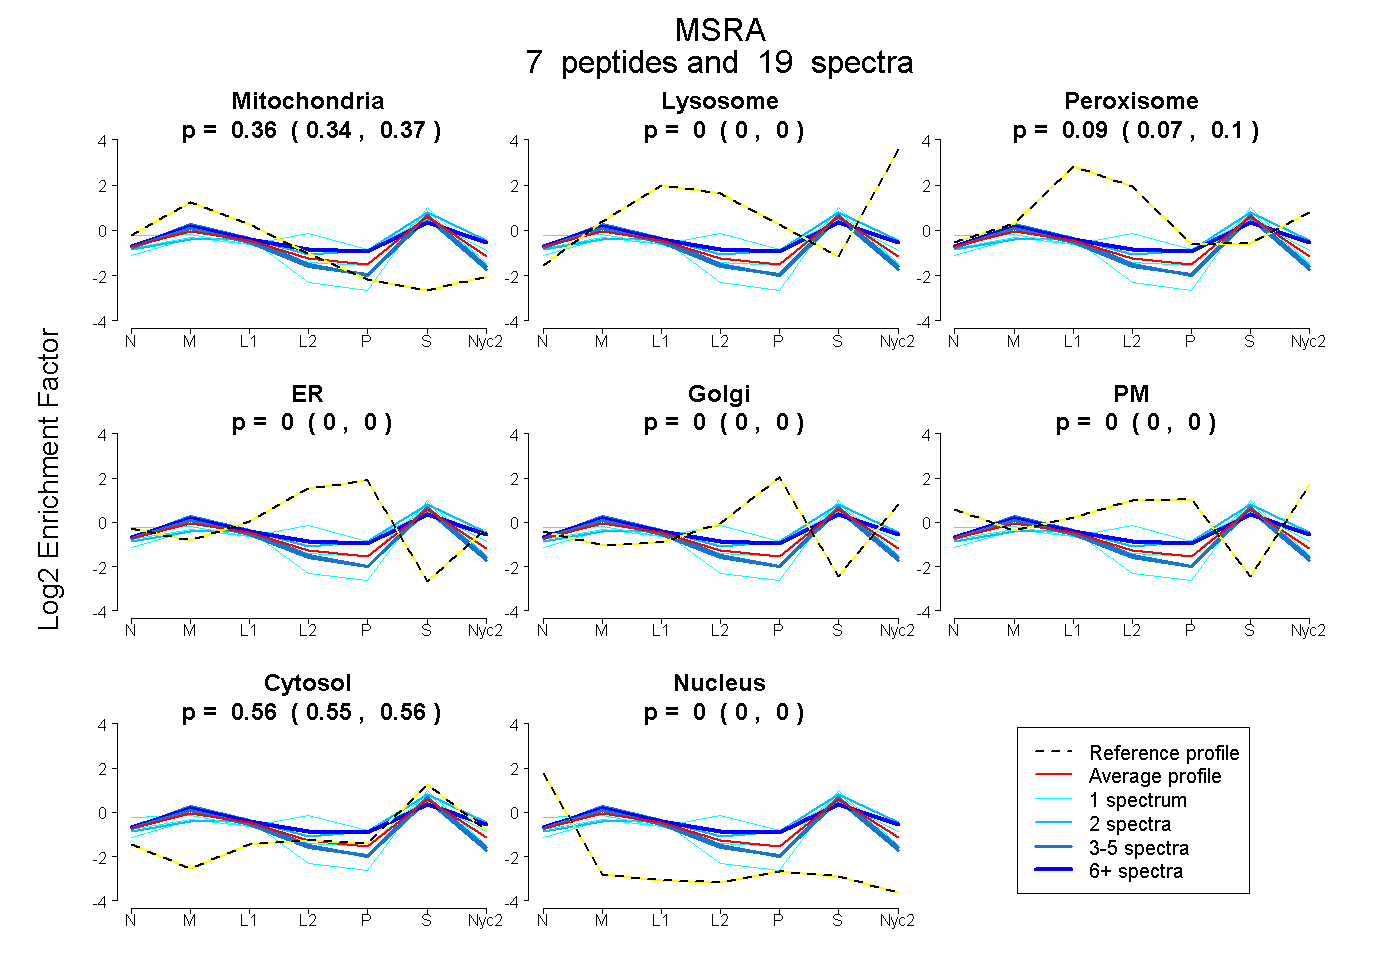
| Expt A |
7 peptides |
19 spectra |
|
0.357 0.343 | 0.370 |
0.000 0.000 | 0.000 |
0.087 0.070 | 0.101 |
0.000 0.000 | 0.000 |
0.000 0.000 | 0.000 |
0.000 0.000 | 0.000 |
0.555 0.547 | 0.563 |
0.000 0.000 | 0.000 |
| 1 spectrum, GVYSTQVGFAGGYTR | 0.361 | 0.000 | 0.000 | 0.000 | 0.000 | 0.000 | 0.639 | 0.000 | ||
| 7 spectra, VFWENHDPTQGMR | 0.322 | 0.130 | 0.064 | 0.000 | 0.000 | 0.000 | 0.483 | 0.000 | ||
| 1 spectrum, TGHAEVVR | 0.222 | 0.000 | 0.184 | 0.025 | 0.000 | 0.070 | 0.499 | 0.000 | ||
| 3 spectra, VISAEEALPGR | 0.440 | 0.000 | 0.000 | 0.000 | 0.000 | 0.000 | 0.560 | 0.000 | ||
| 2 spectra, SAVYPTSAVQMEAALK | 0.197 | 0.101 | 0.097 | 0.000 | 0.000 | 0.000 | 0.604 | 0.000 | ||
| 1 spectrum, EVCSEK | 0.350 | 0.000 | 0.019 | 0.000 | 0.000 | 0.000 | 0.631 | 0.000 | ||
| 4 spectra, QGNDCGTQYR | 0.487 | 0.000 | 0.000 | 0.000 | 0.000 | 0.000 | 0.513 | 0.000 |
| Plot | Mito | Lyso or Perox | ER | Golgi | PM | Cytosol | Nucleus | ||||||
| Expt B |
4 peptides |
9 spectra |
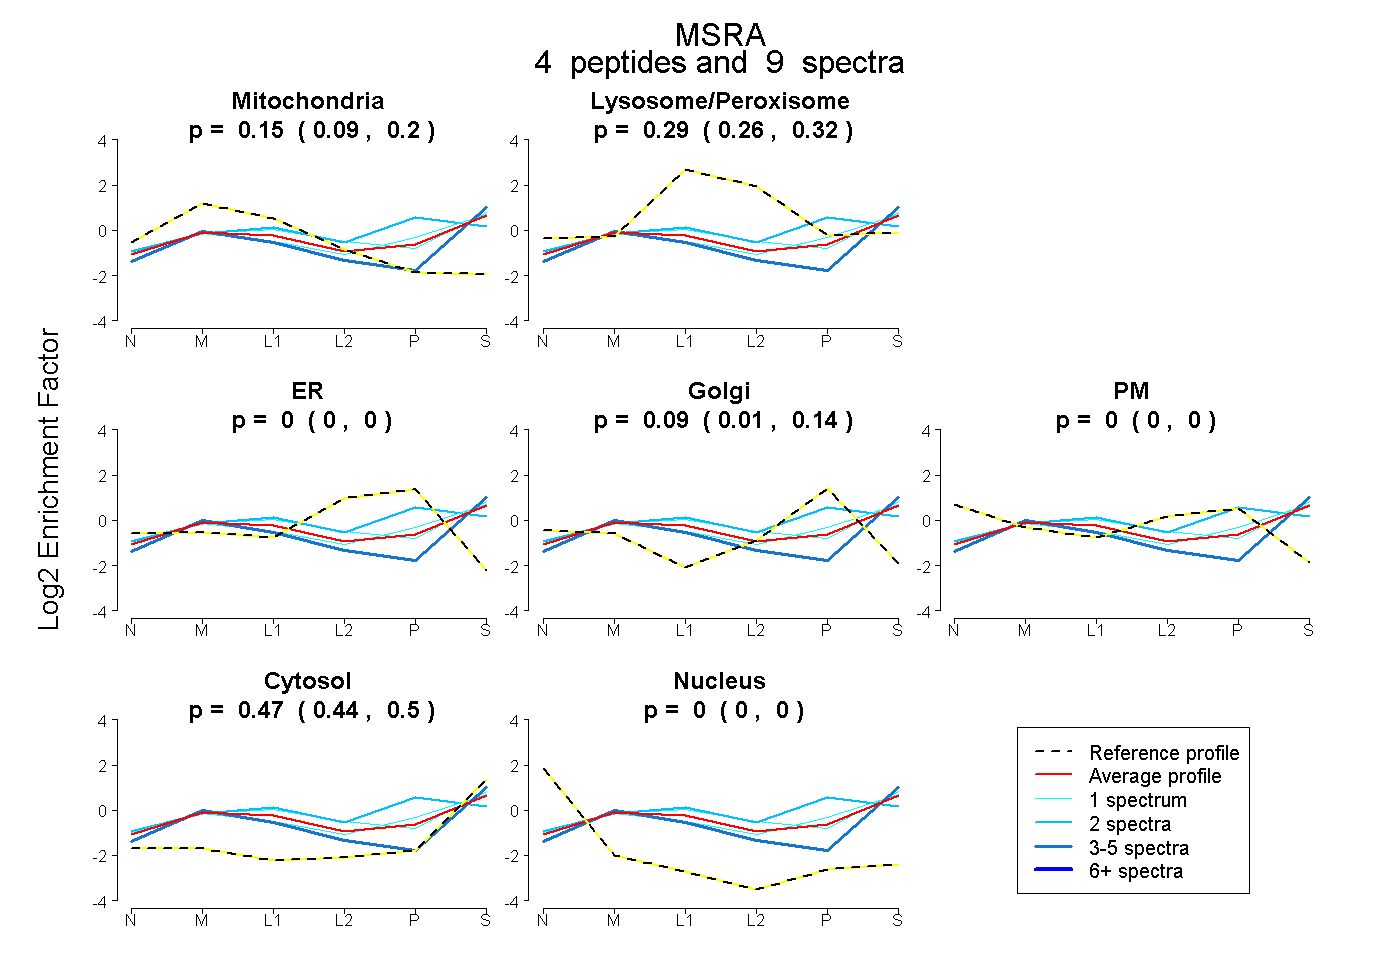 |
0.149 0.087 | 0.203 |
0.294 0.260 | 0.322 |
0.000 0.000 | 0.000 |
0.086 0.012 | 0.145 |
0.000 0.000 | 0.000 |
0.471 0.435 | 0.503 |
0.000 0.000 | 0.000 |
|||
| Plot | Lyso | Other | |||||||||||
| Expt C |
7 peptides |
42 spectra |
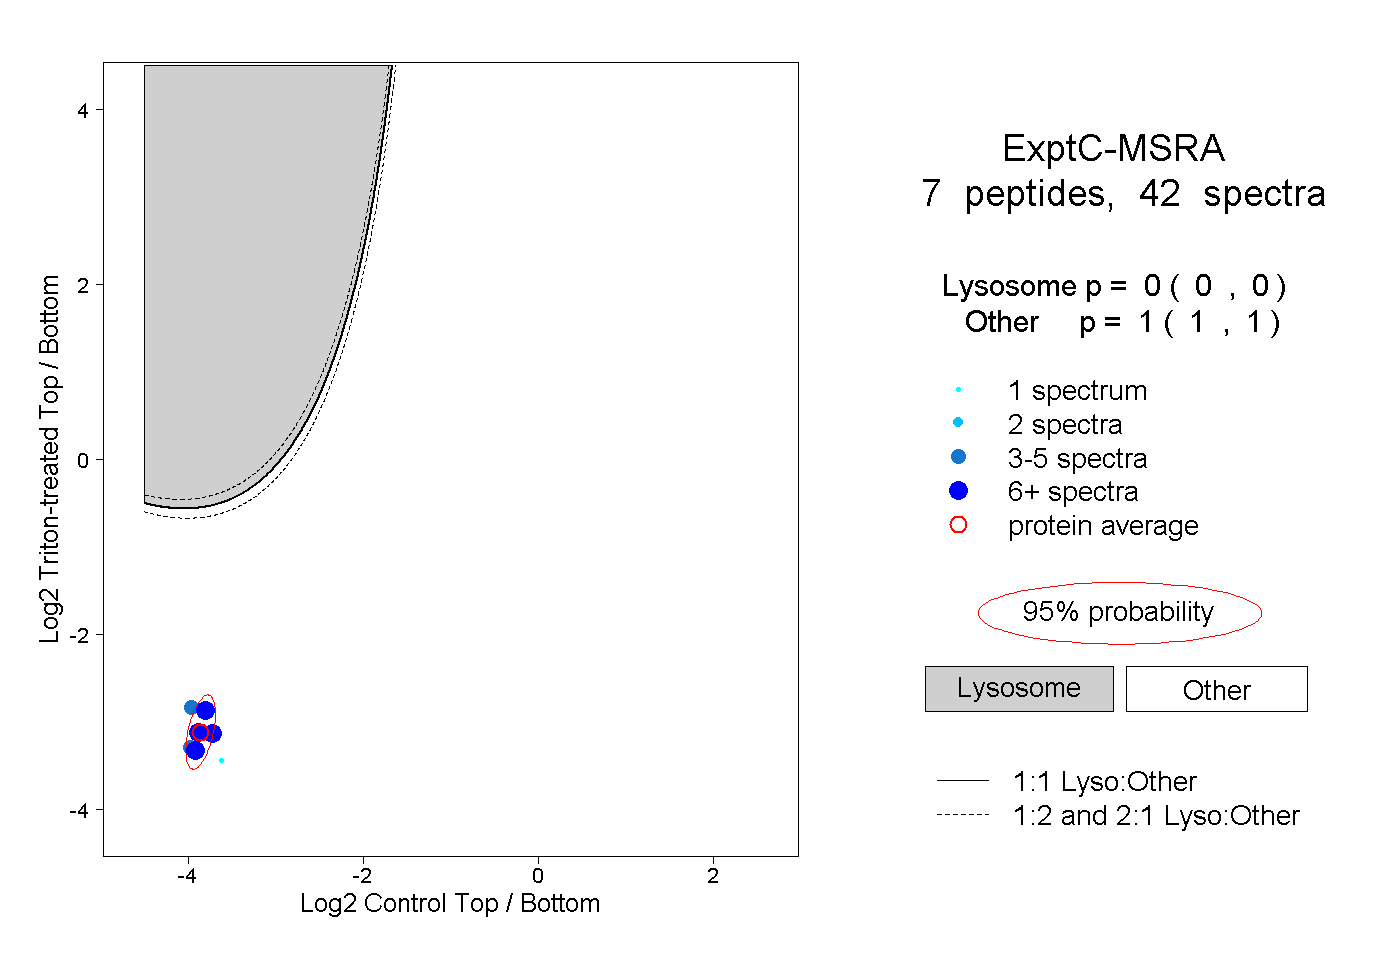 |
0.000 0.000 | 0.000 |
1.000 1.000 | 1.000 |
||||||||
| Plot | Lyso | Other | |||||||||||
| Expt D |
2 peptides |
5 spectra |
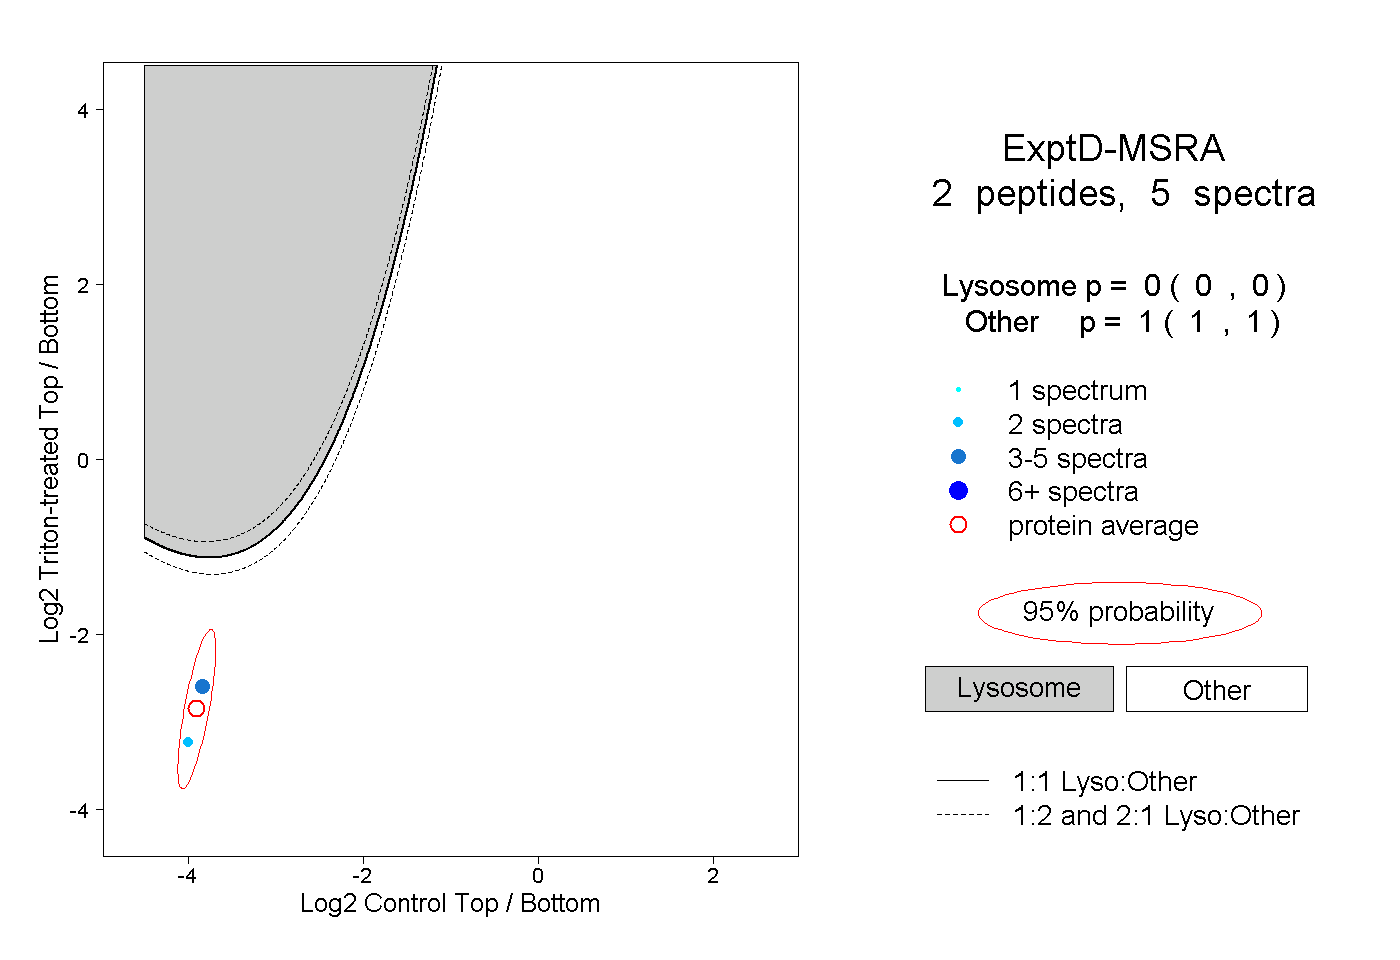 |
0.000 0.000 | 0.000 |
1.000 1.000 | 1.000 |