 2
2peptides
spectra
0.000 | 0.054
0.184 | 0.326
0.000 | 0.051
0.000 | 0.085
0.000 | 0.000
0.635 | 0.744
0.000 | 0.000
1peptide
spectrum
NA | NA
NA | NA
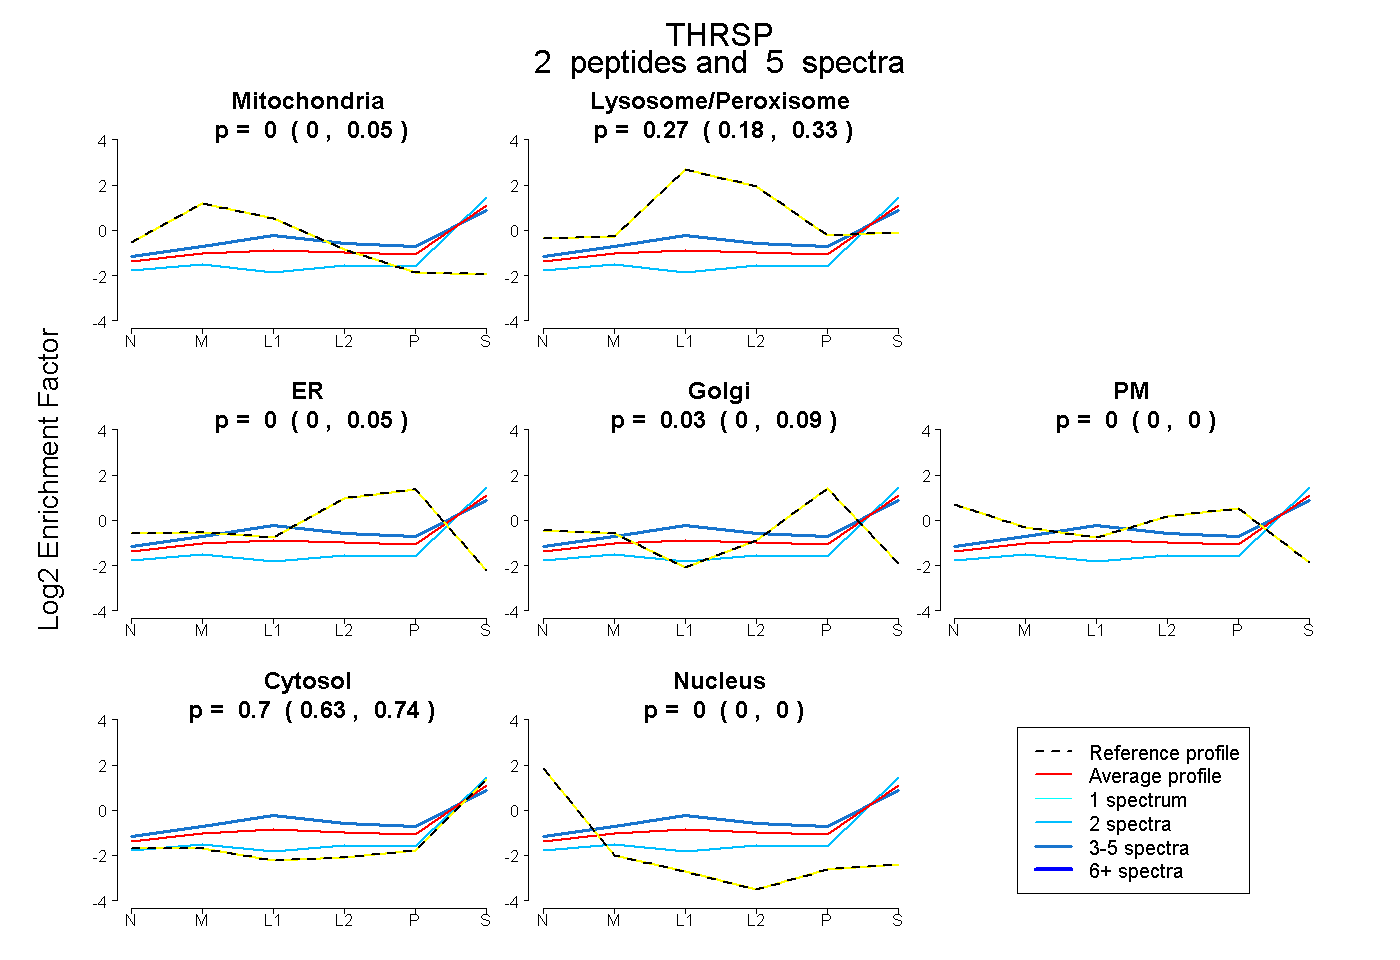
| Plot | Mito | Lyso or Perox | ER | Golgi | PM | Cytosol | Nucleus | ||||||
| Expt B |
2 peptides |
5 spectra |
|
0.000 0.000 | 0.054 |
0.274 0.184 | 0.326 |
0.000 0.000 | 0.051 |
0.026 0.000 | 0.085 |
0.000 0.000 | 0.000 |
0.699 0.635 | 0.744 |
0.000 0.000 | 0.000 |
|||
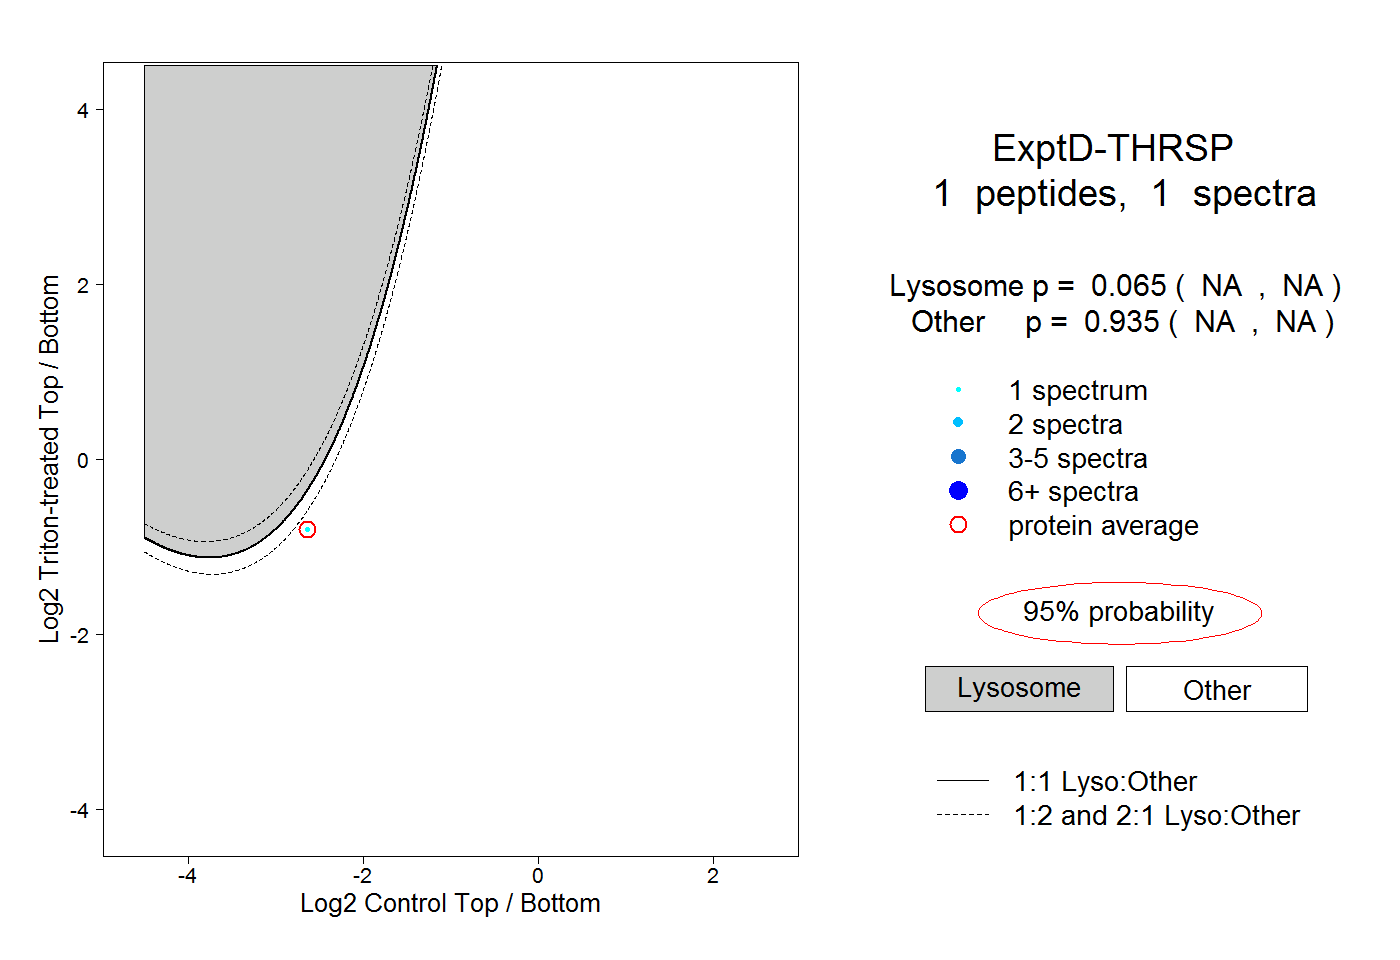
| Plot | Lyso | Other | |||||||||||
| Expt D |
1 peptide |
1 spectrum |
|
0.065 NA | NA |
0.935 NA | NA |