 4
4peptides
spectra
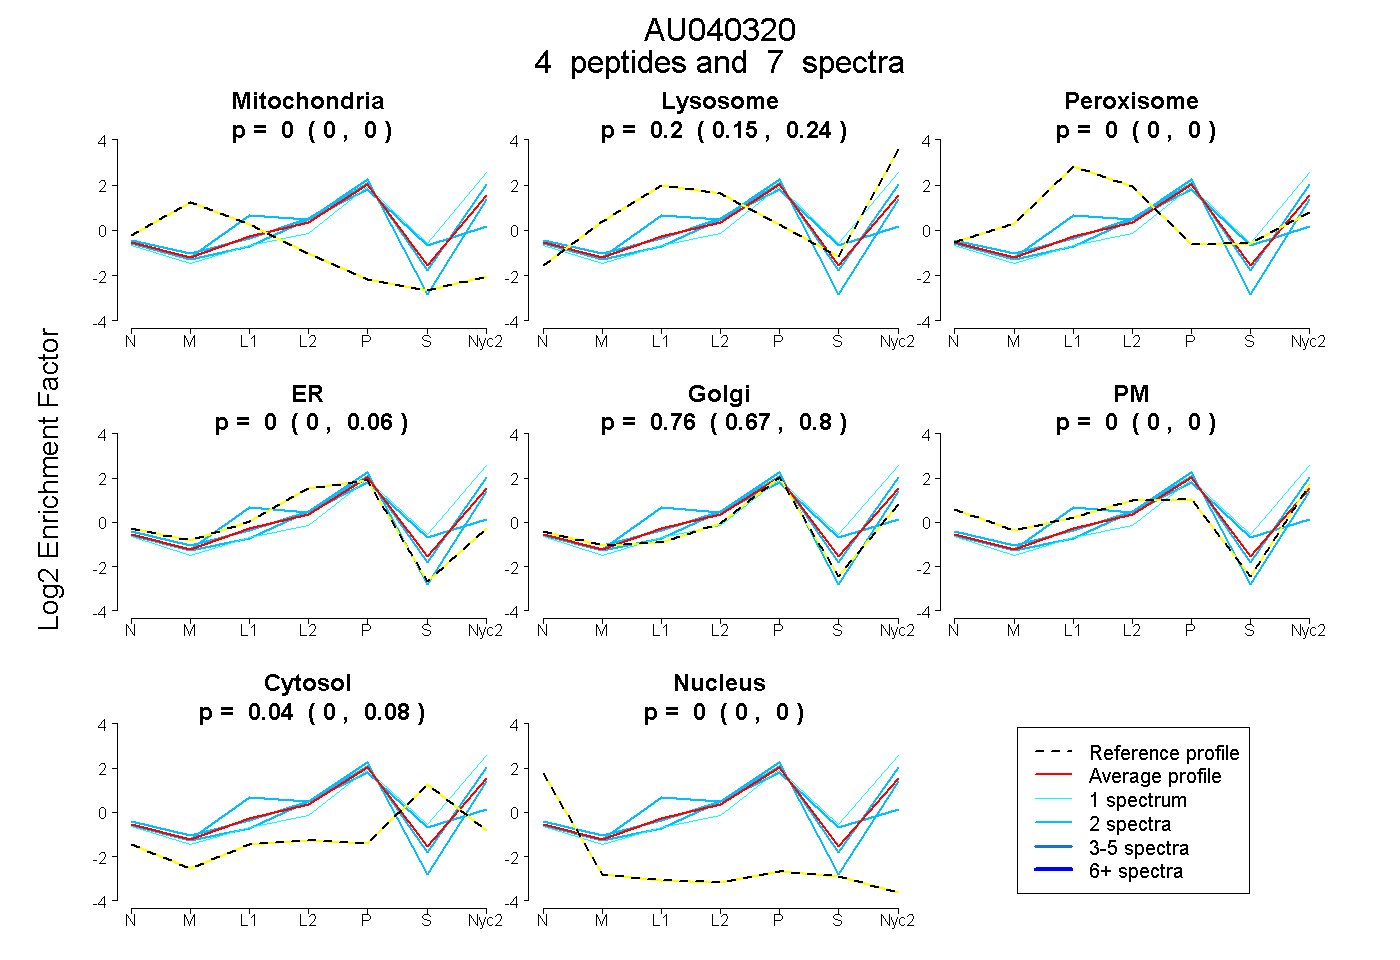
0.000 | 0.000
0.146 | 0.245
0.000 | 0.000
0.000 | 0.056
0.673 | 0.802
0.000 | 0.000
0.000 | 0.084
0.000 | 0.000
1peptide
spectrum
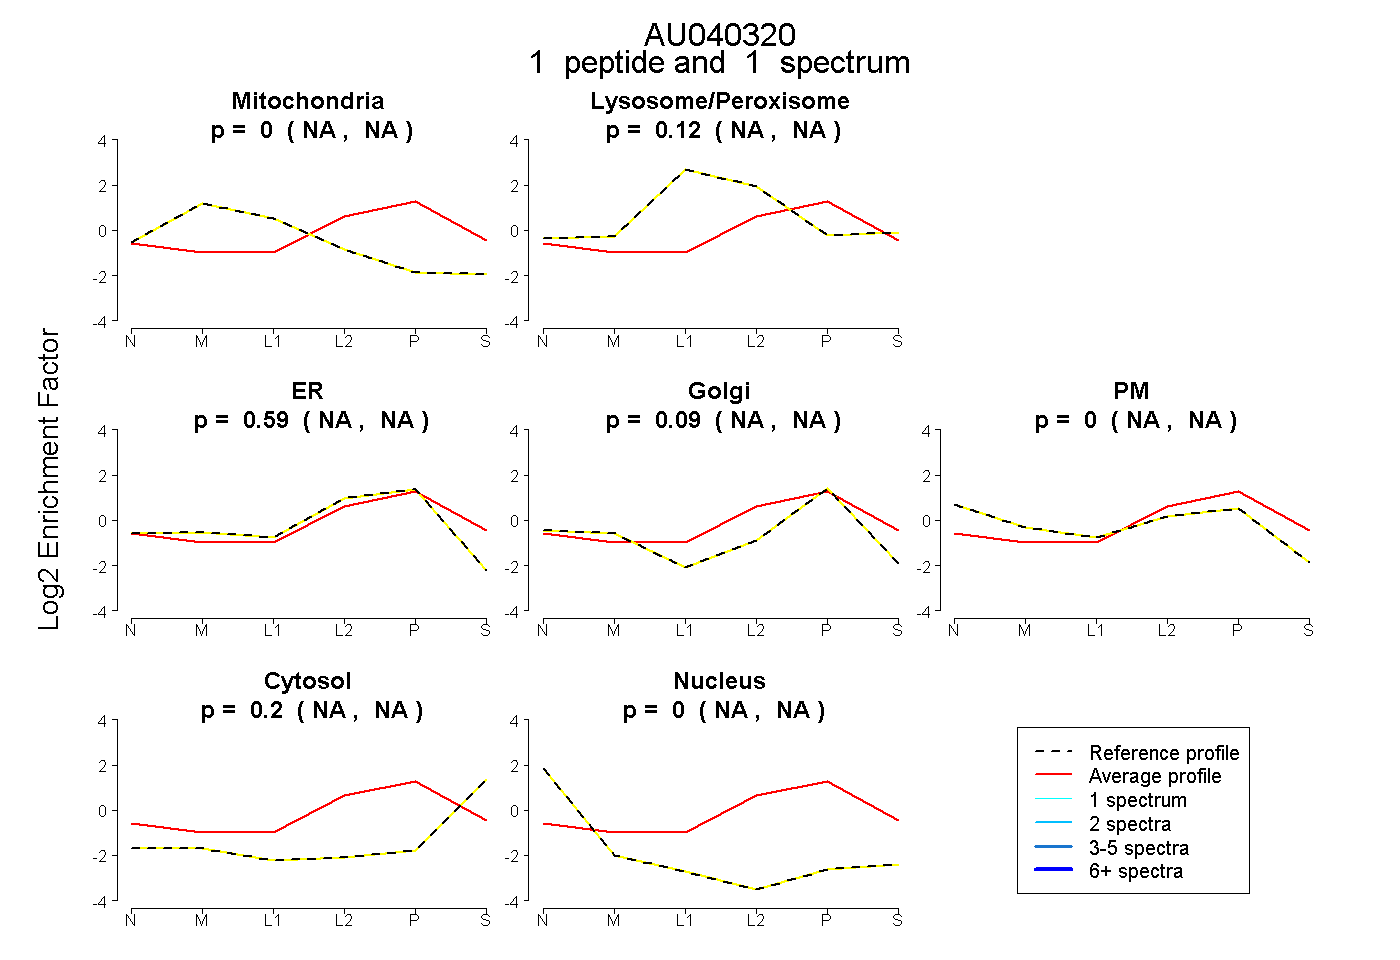
NA | NA
NA | NA
NA | NA
NA | NA
NA | NA
NA | NA
NA | NA
5peptides
spectra
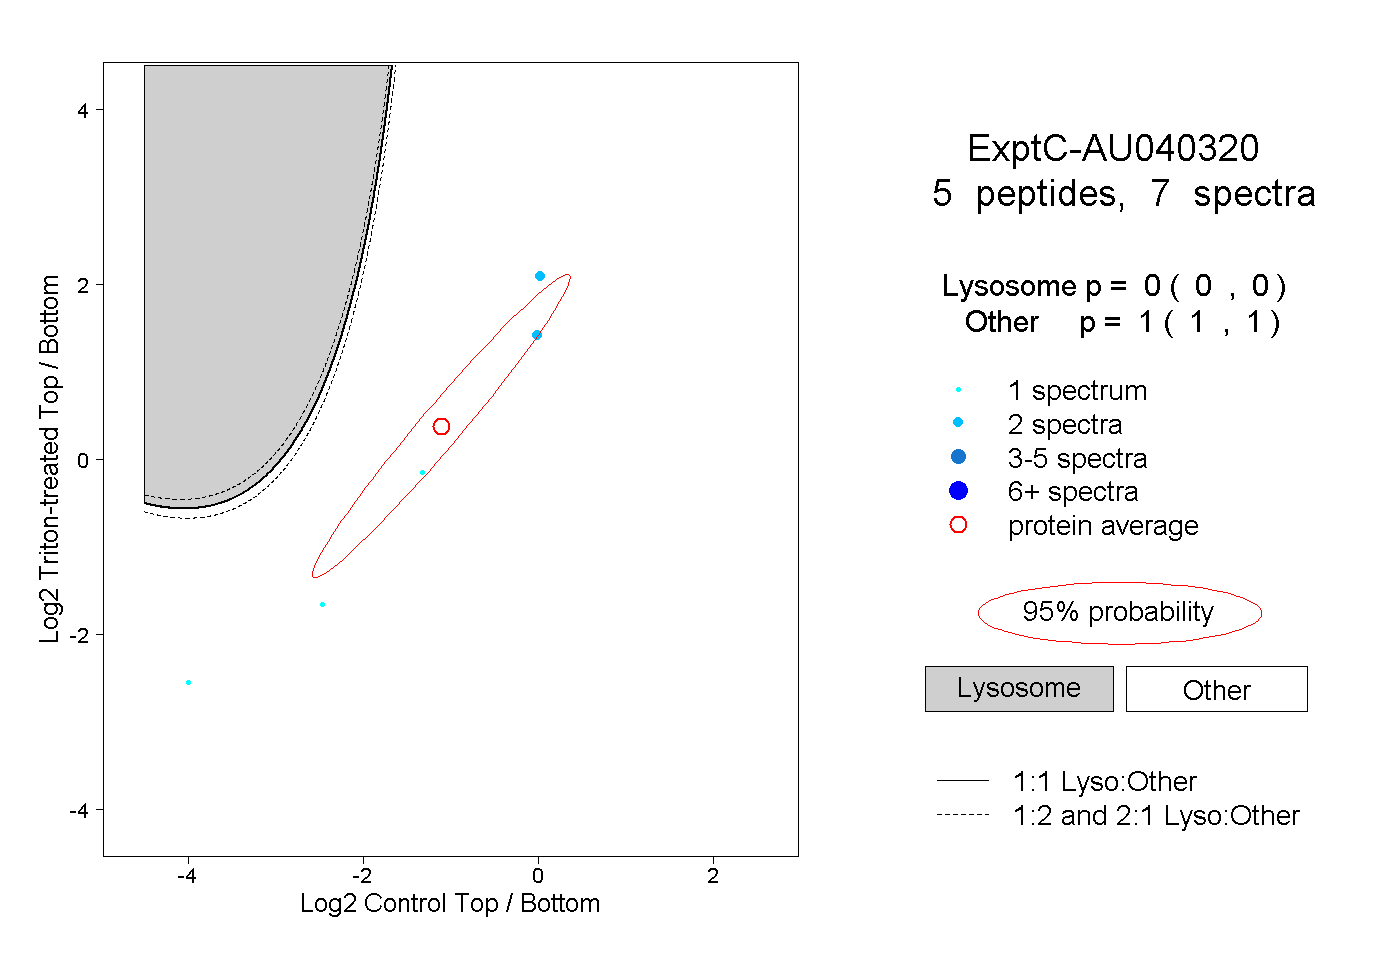
0.000 | 0.000
1.000 | 1.000