 6
6peptides
spectra
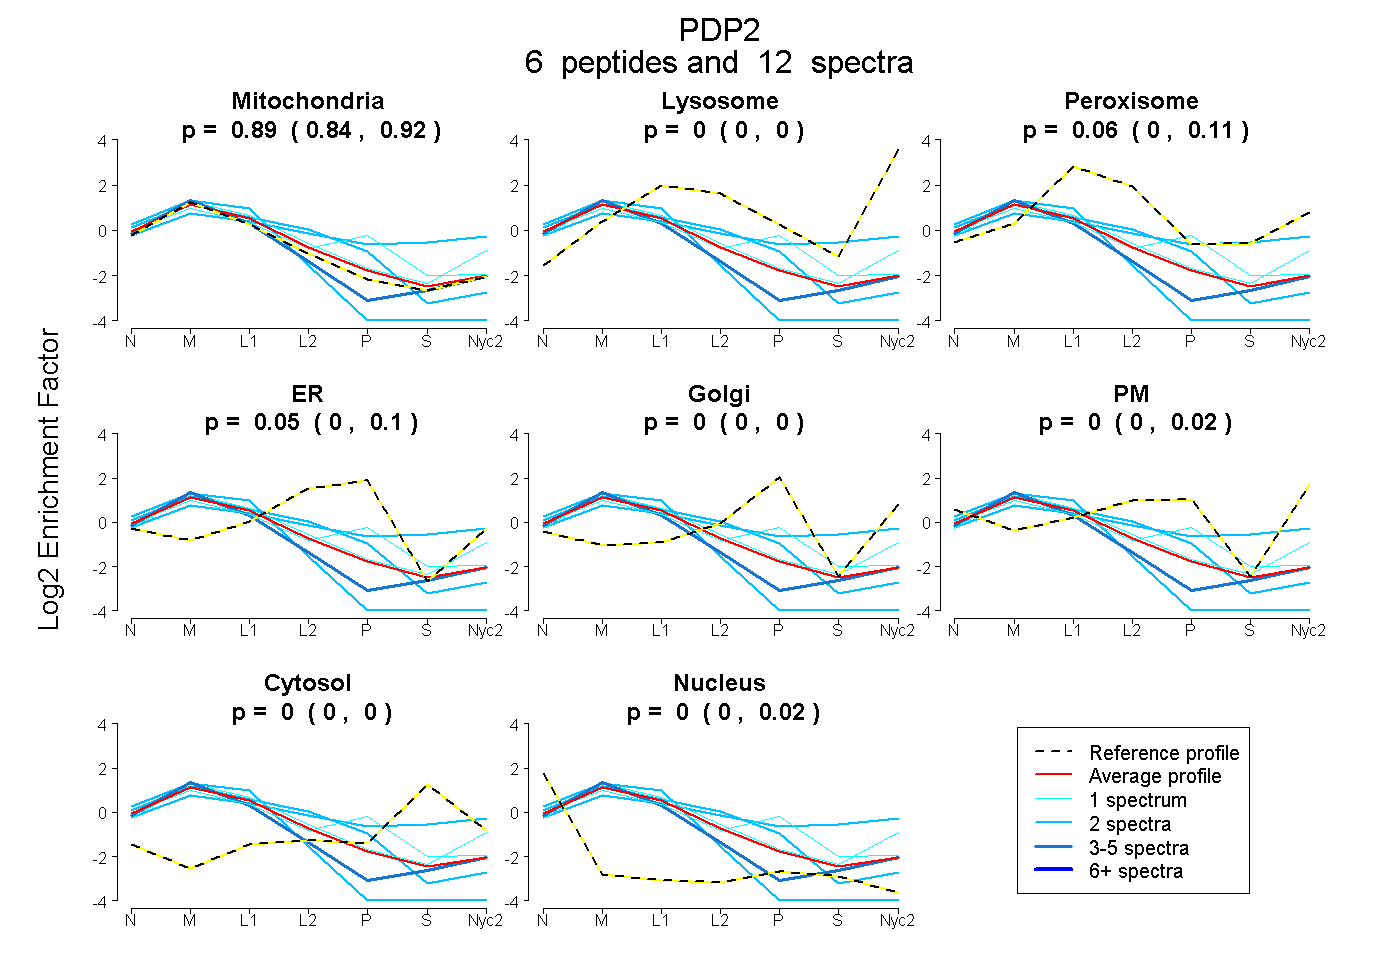
0.839 | 0.924
0.000 | 0.000
0.003 | 0.109
0.000 | 0.101
0.000 | 0.000
0.000 | 0.020
0.000 | 0.000
0.000 | 0.023
8peptides
spectra
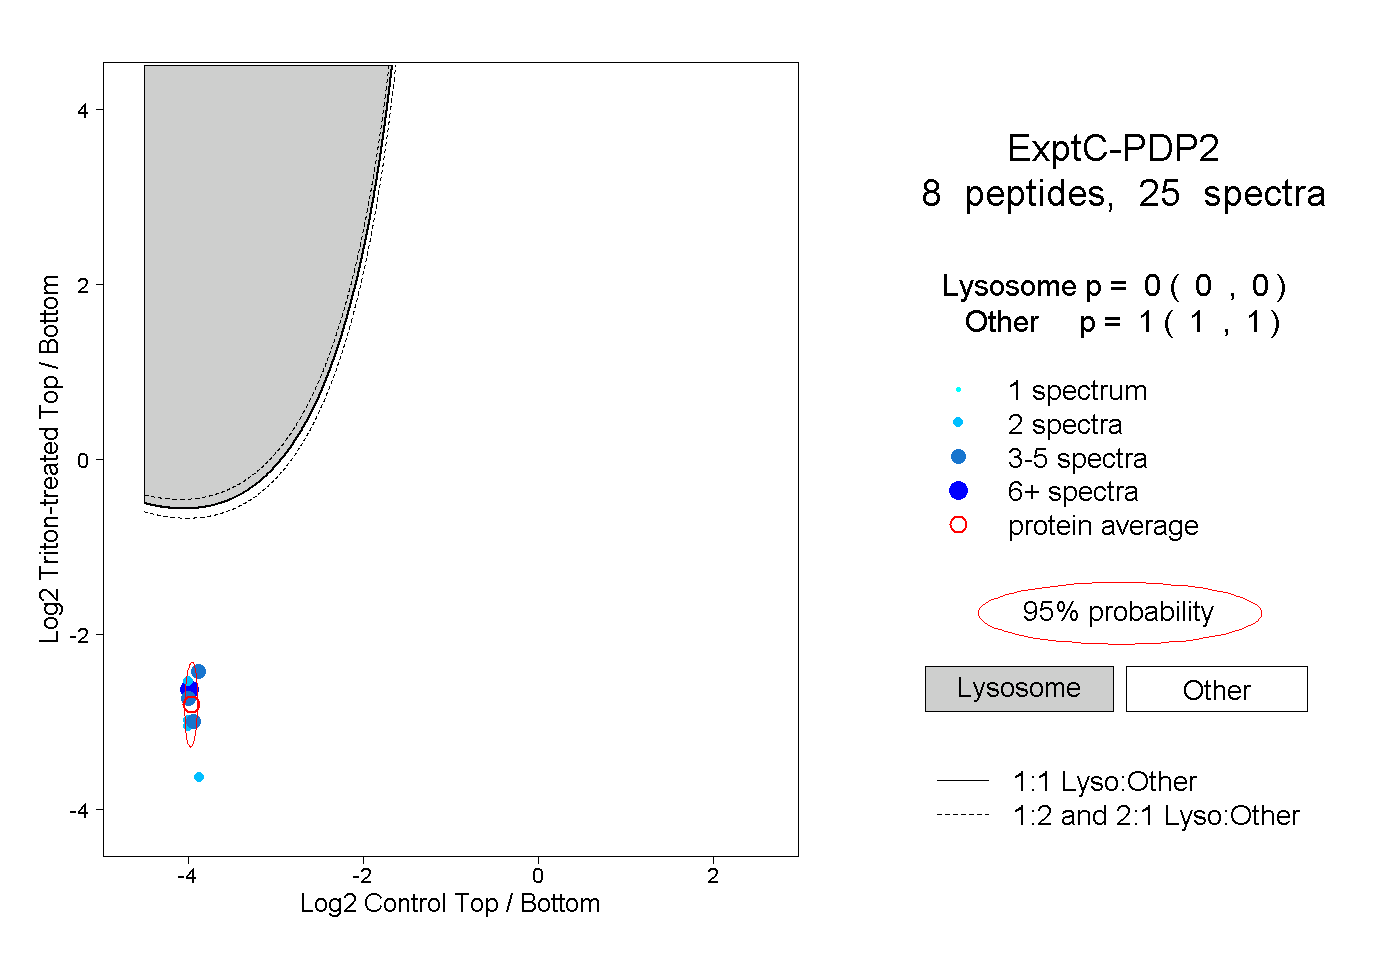
0.000 | 0.000
1.000 | 1.000
1peptide
spectrum
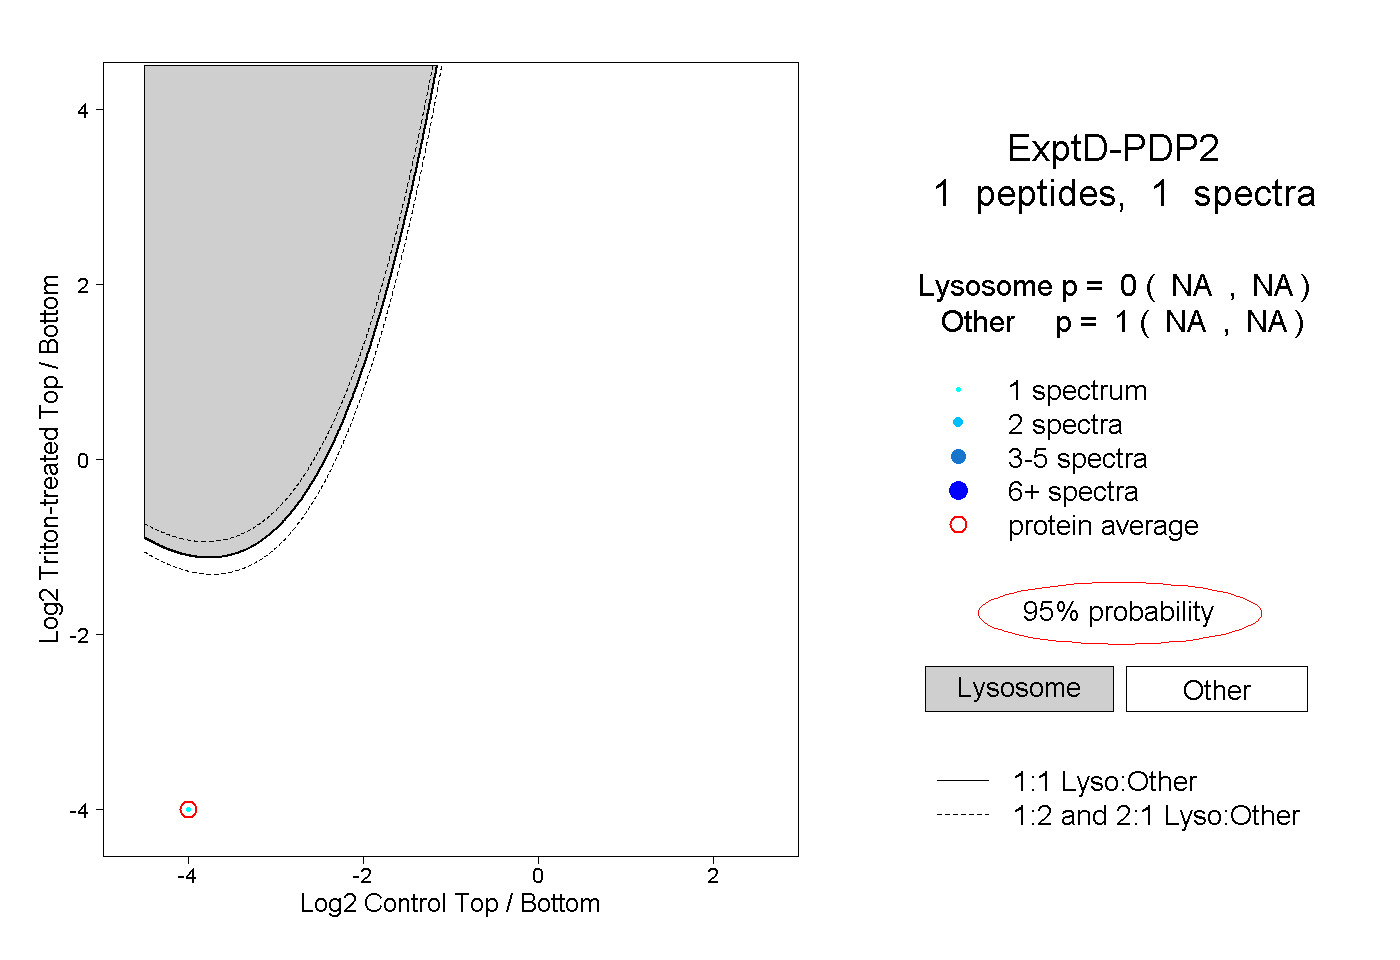
NA | NA
NA | NA