PSMC2
[ENSRNOP00000016450]
Main page
| | | Plot |
Mito |
Lyso |
|
Perox |
ER |
Golgi |
PM |
Cytosol |
Nucleus |
|
| Expt A |
 24
24
peptides |
102
spectra |
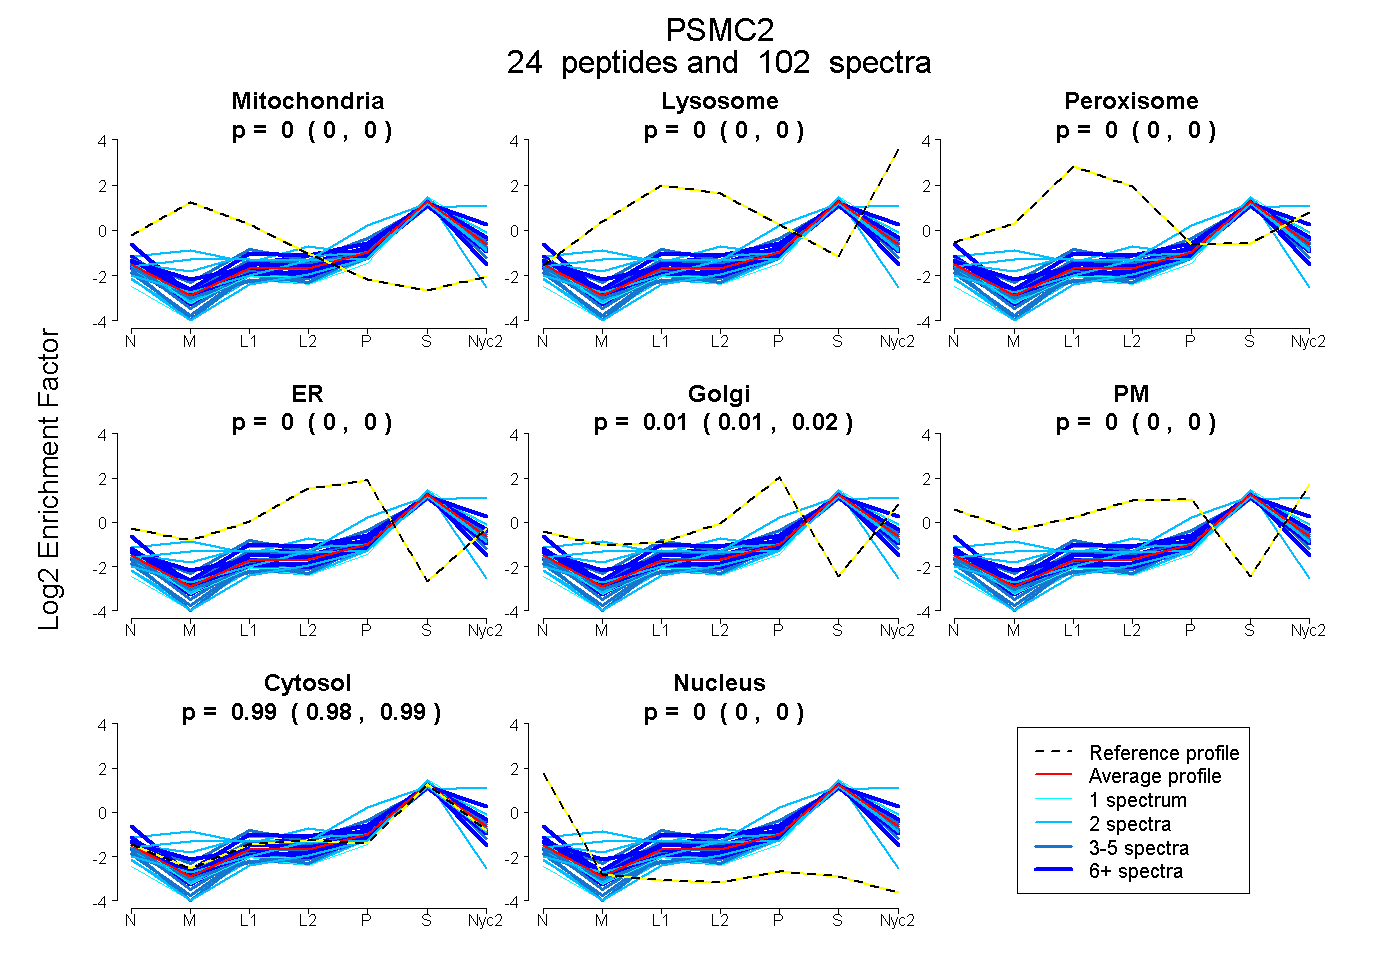 |
0.000
0.000 | 0.000 |
0.000
0.000 | 0.000 |
|
0.000
0.000 | 0.000 |
0.000
0.000 | 0.000 |
0.013
0.011 | 0.015 |
0.000
0.000 | 0.000 |
0.987
0.984 | 0.989 |
0.000
0.000 | 0.000 |
|
| | | Plot |
Mito |
|
Lyso or Perox |
|
ER |
Golgi |
PM |
Cytosol |
Nucleus |
|
| Expt B |
14
peptides |
25
spectra |
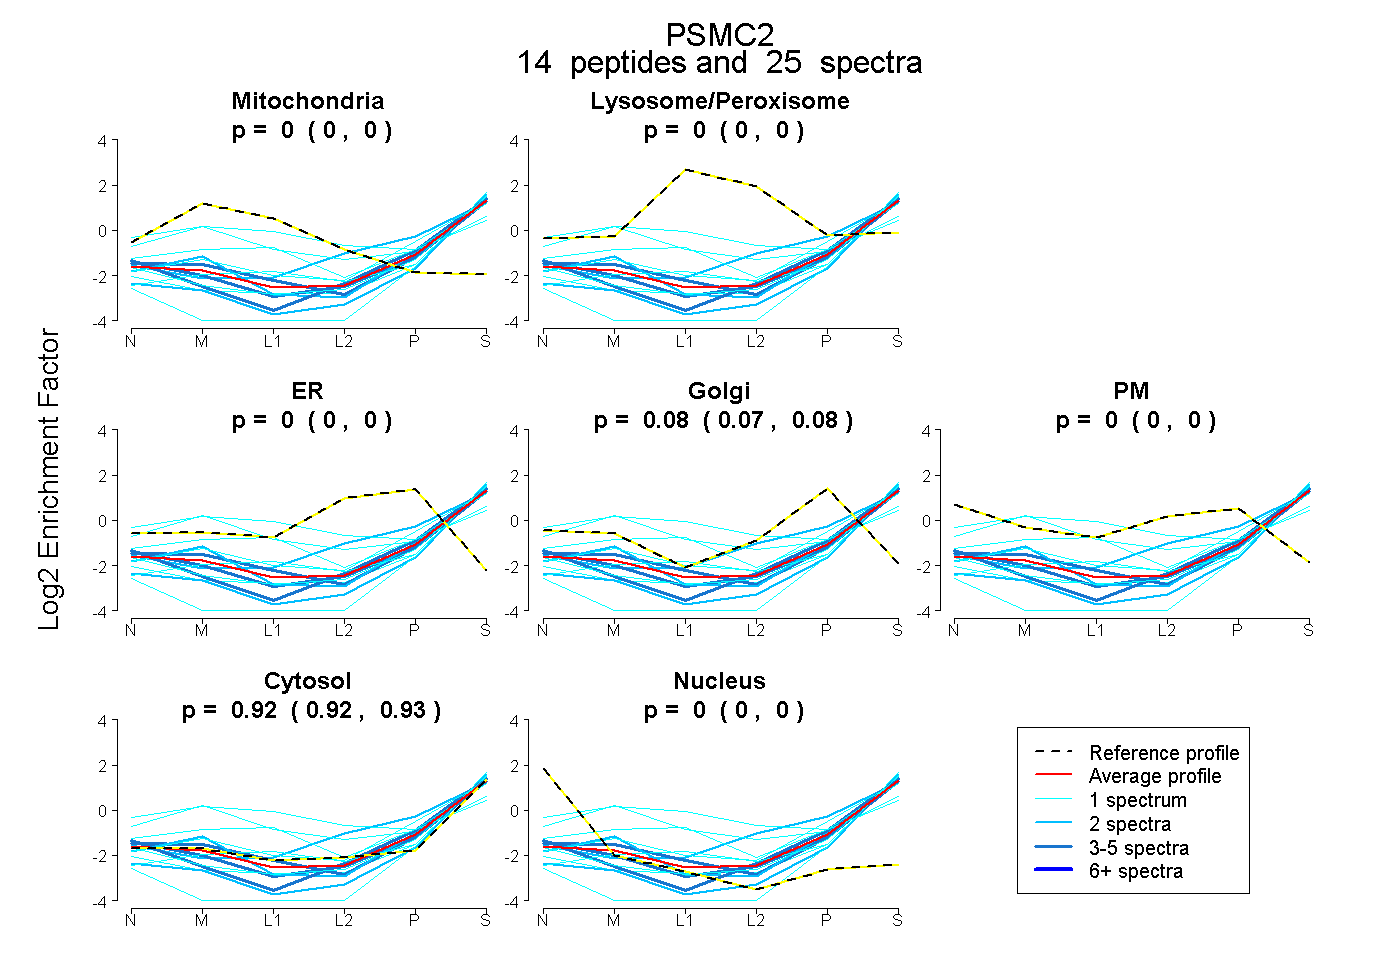 |
0.000
0.000 | 0.000 |
|
0.000
0.000 | 0.000 |
|
0.000
0.000 | 0.000 |
0.075
0.066 | 0.083 |
0.000
0.000 | 0.000 |
0.925
0.915 | 0.933 |
0.000
0.000 | 0.000 |
|
| | | Plot |
|
Lyso |
|
|
|
|
|
|
|
Other |
| Expt C |
19
peptides |
69
spectra |
 |
|
0.000
0.000 | 0.000 |
|
|
|
|
|
|
|
1.000
1.000 | 1.000 |
| 3 spectra, QTLQSEQPLQVAR |
|
0.000 |
|
|
|
|
|
|
|
1.000 |
| 4 spectra, LCPNSTGAEIR |
|
0.000 |
|
|
|
|
|
|
|
1.000 |
| 3 spectra, TDACFIR |
|
0.000 |
|
|
|
|
|
|
|
1.000 |
| 2 spectra, IINADSEDPK |
|
0.000 |
|
|
|
|
|
|
|
1.000 |
| 1 spectrum, QVEDDIQQLLK |
|
0.000 |
|
|
|
|
|
|
|
1.000 |
| 3 spectra, FSATPR |
|
0.000 |
|
|
|
|
|
|
|
1.000 |
| 1 spectrum, VIGSELVQK |
|
0.000 |
|
|
|
|
|
|
|
1.000 |
| 4 spectra, ALDEGDIALLK |
|
0.000 |
|
|
|
|
|
|
|
1.000 |
| 4 spectra, YIINVK |
|
0.000 |
|
|
|
|
|
|
|
1.000 |
| 6 spectra, TYGQSTYSR |
|
0.000 |
|
|
|
|
|
|
|
1.000 |
| 5 spectra, ELFEMAR |
|
0.000 |
|
|
|
|
|
|
|
1.000 |
| 1 spectrum, FELLAR |
|
0.000 |
|
|
|
|
|
|
|
1.000 |
| 4 spectra, SVCTEAGMFAIR |
|
0.000 |
|
|
|
|
|
|
|
1.000 |
| 2 spectra, GVLLFGPPGTGK |
|
0.000 |
|
|
|
|
|
|
|
1.000 |
| 2 spectra, INELTGIK |
|
0.000 |
|
|
|
|
|
|
|
1.000 |
| 7 spectra, YQIHIPLPPK |
|
0.000 |
|
|
|
|
|
|
|
1.000 |
| 2 spectra, PDYLGADQR |
|
0.000 |
|
|
|
|
|
|
|
1.000 |
| 8 spectra, FDDGAGGDNEVQR |
|
0.000 |
|
|
|
|
|
|
|
1.000 |
| 7 spectra, EVVETPLLHPER |
|
0.000 |
|
|
|
|
|
|
|
1.000 |
| | | Plot |
|
Lyso |
|
|
|
|
|
|
|
Other |
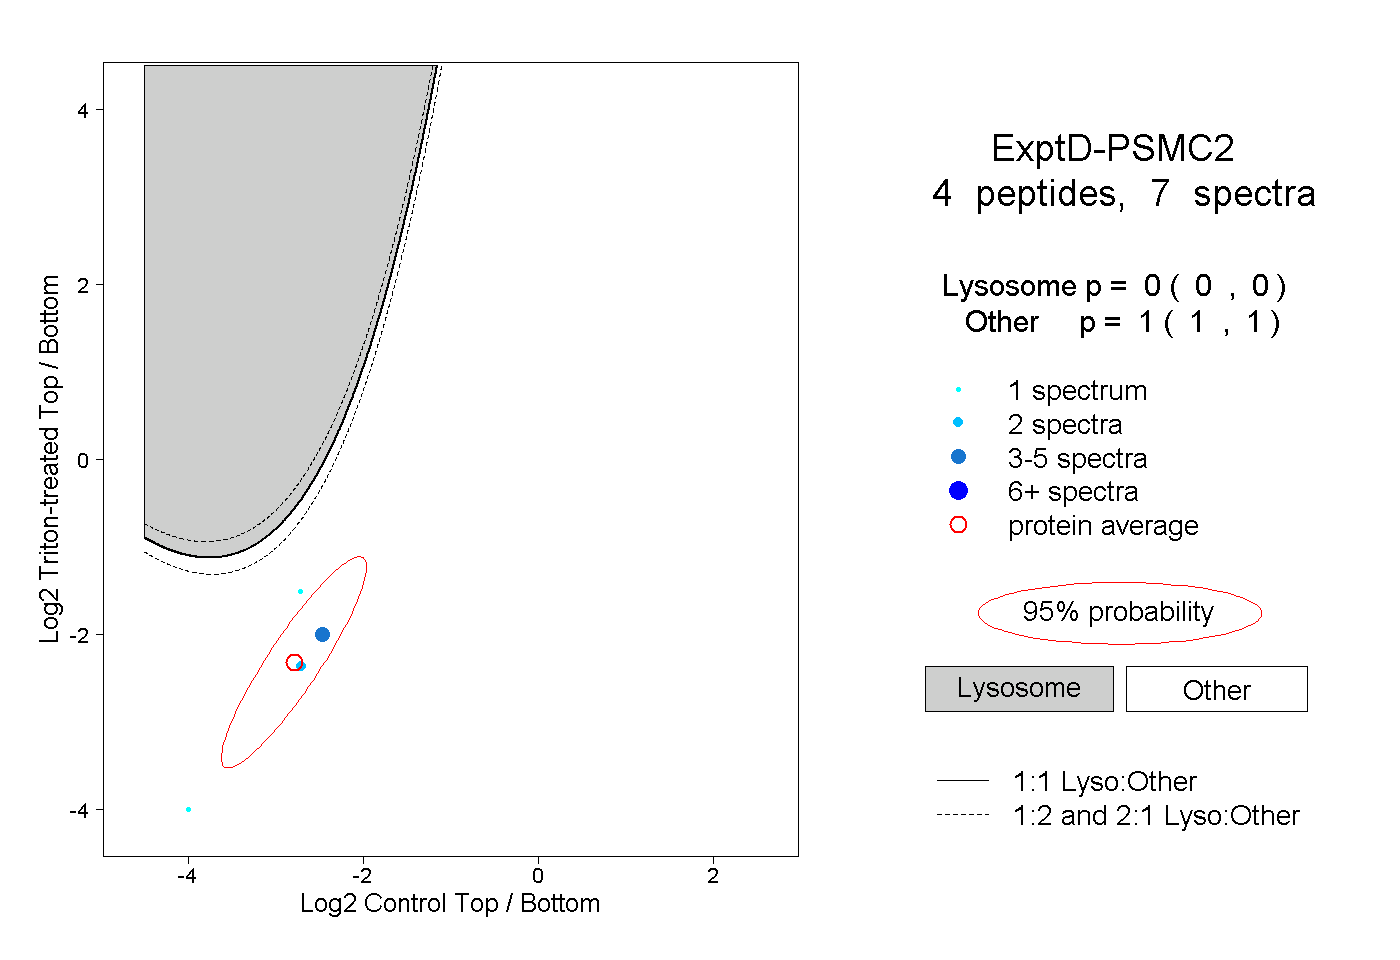
| Expt D |
4
peptides |
7
spectra |
 |
|
0.000
0.000 | 0.000 |
|
|
|
|
|
|
|
1.000
1.000 | 1.000 |