24
24peptides
spectra
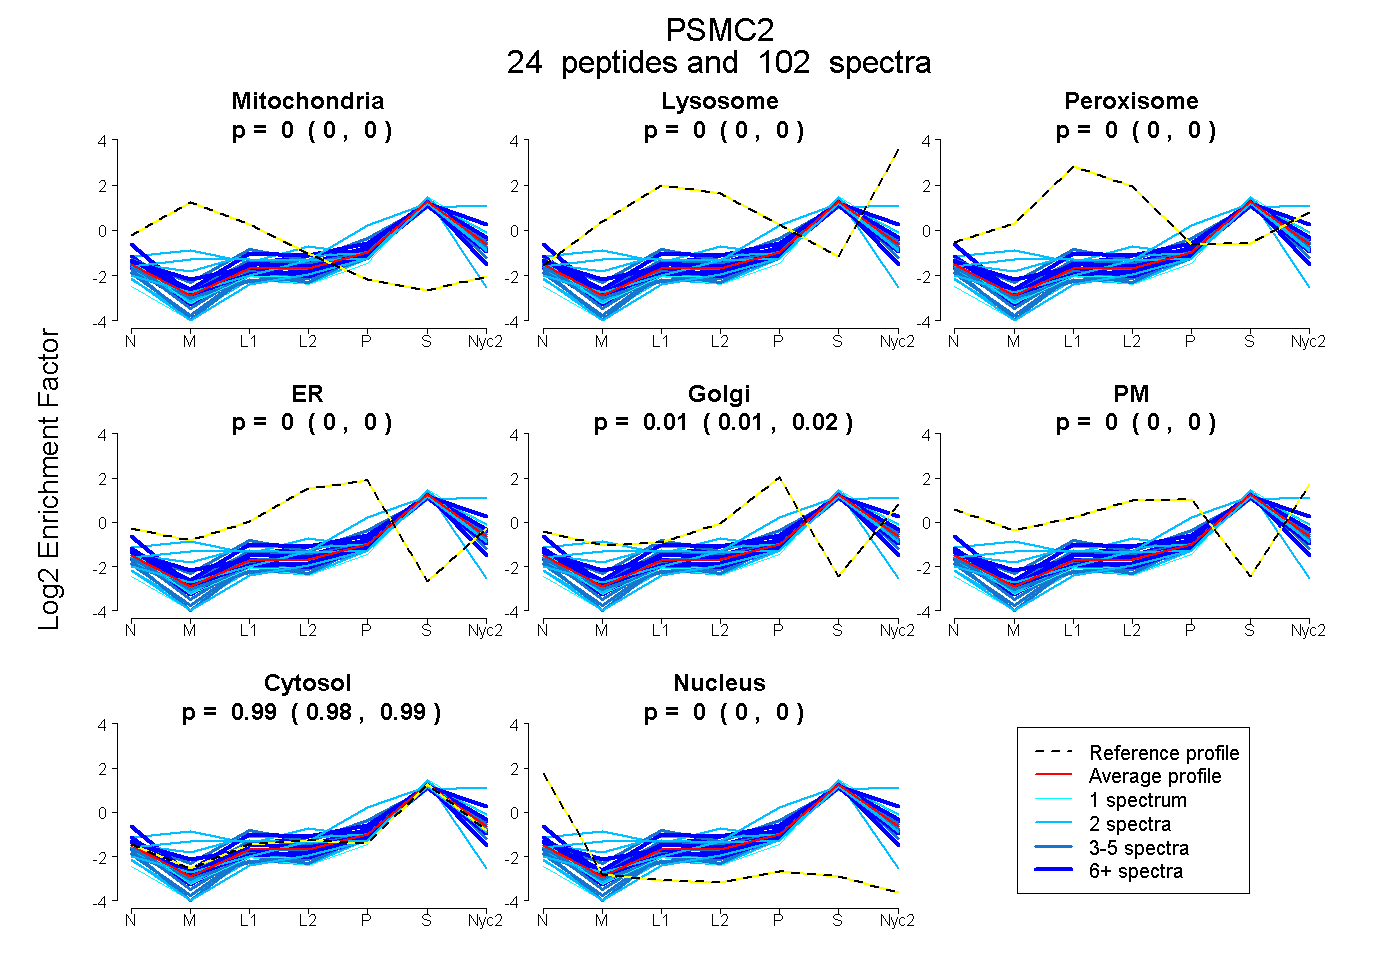
0.000 | 0.000
0.000 | 0.000
0.000 | 0.000
0.000 | 0.000
0.011 | 0.015
0.000 | 0.000
0.984 | 0.989
0.000 | 0.000
14peptides
spectra
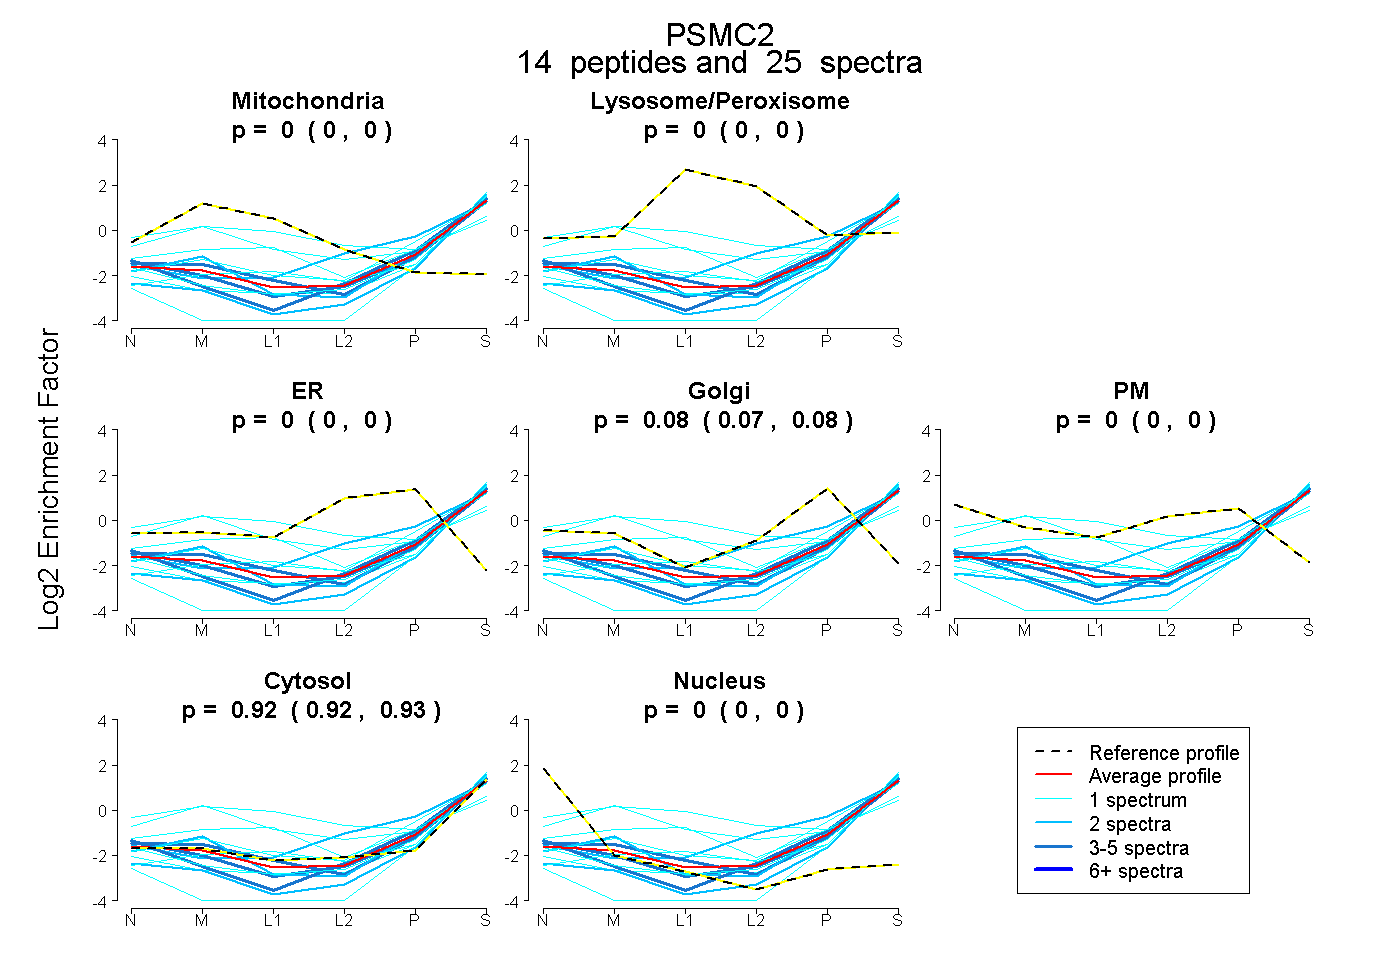
0.000 | 0.000
0.000 | 0.000
0.000 | 0.000
0.066 | 0.083
0.000 | 0.000
0.915 | 0.933
0.000 | 0.000