 4
4peptides
spectra
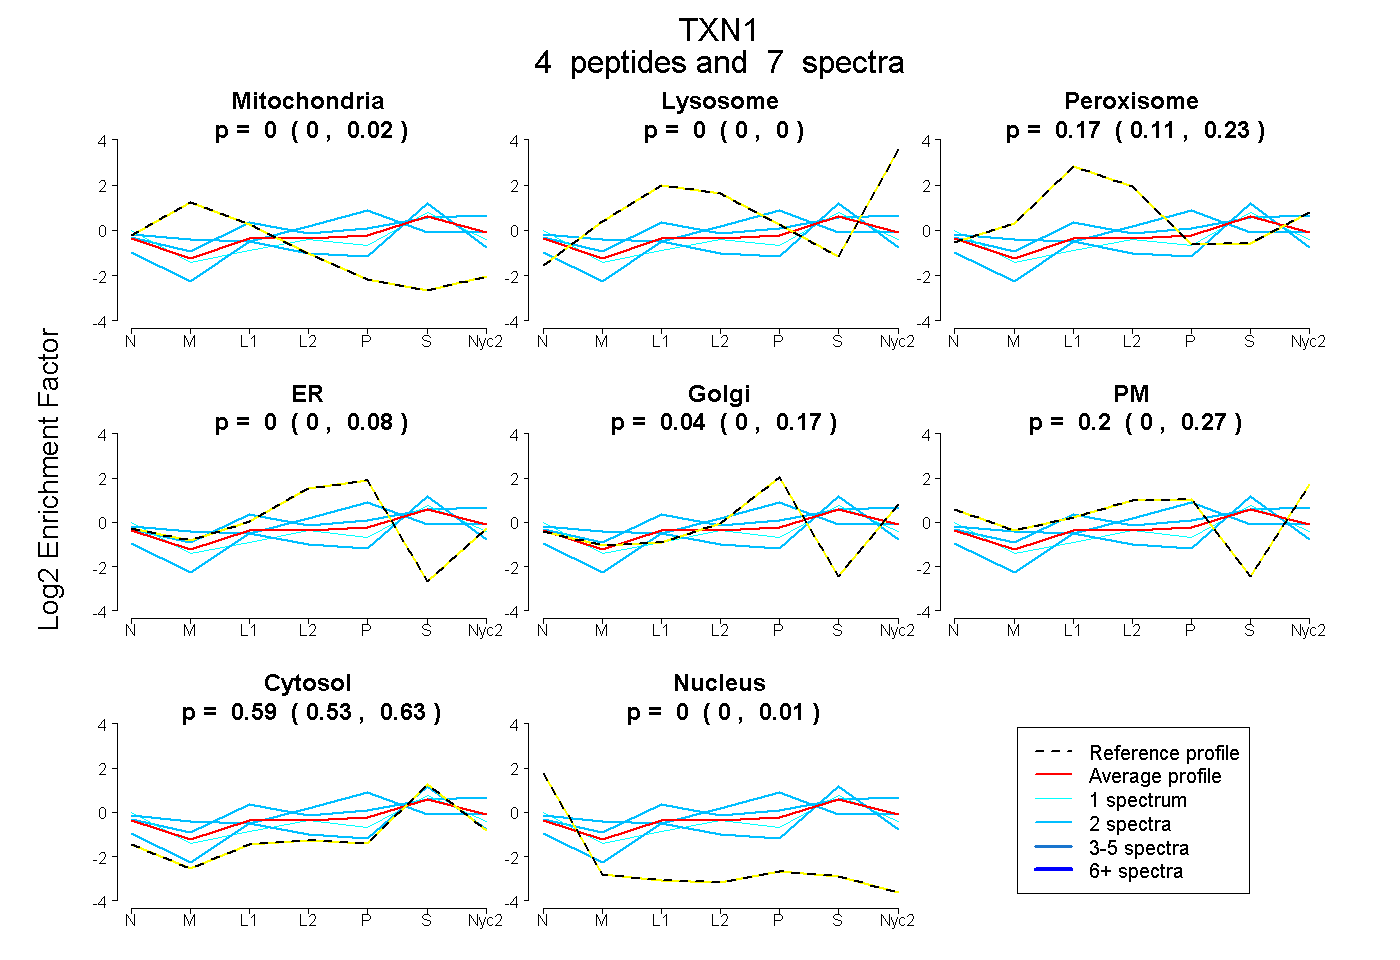
0.000 | 0.024
0.000 | 0.000
0.107 | 0.228
0.000 | 0.077
0.000 | 0.175
0.000 | 0.269
0.529 | 0.627
0.000 | 0.007
1peptide
spectrum
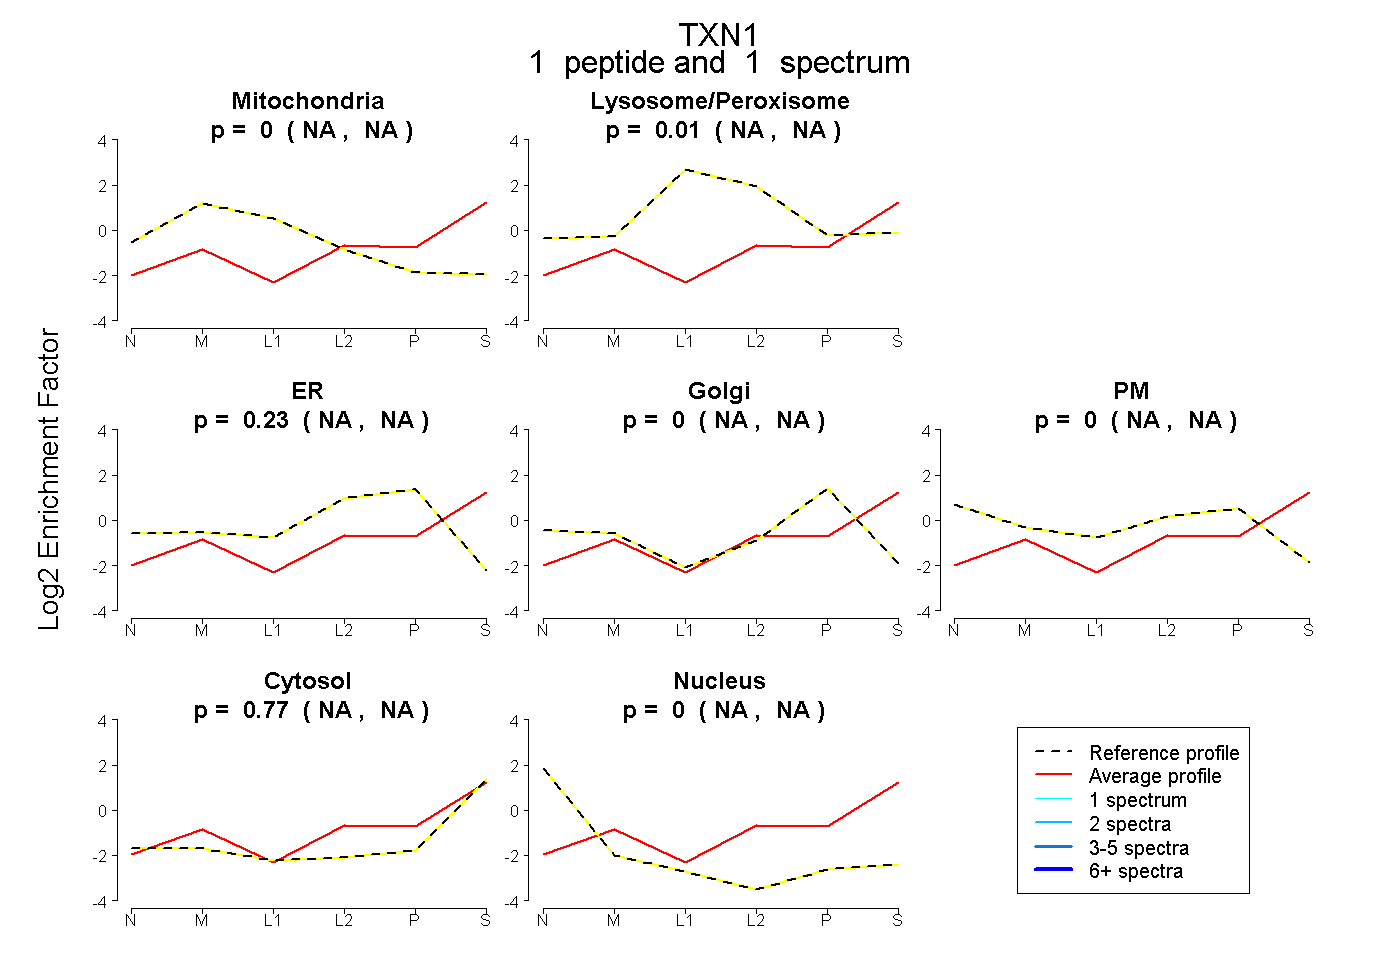
NA | NA
NA | NA
NA | NA
NA | NA
NA | NA
NA | NA
NA | NA
3peptides
spectra
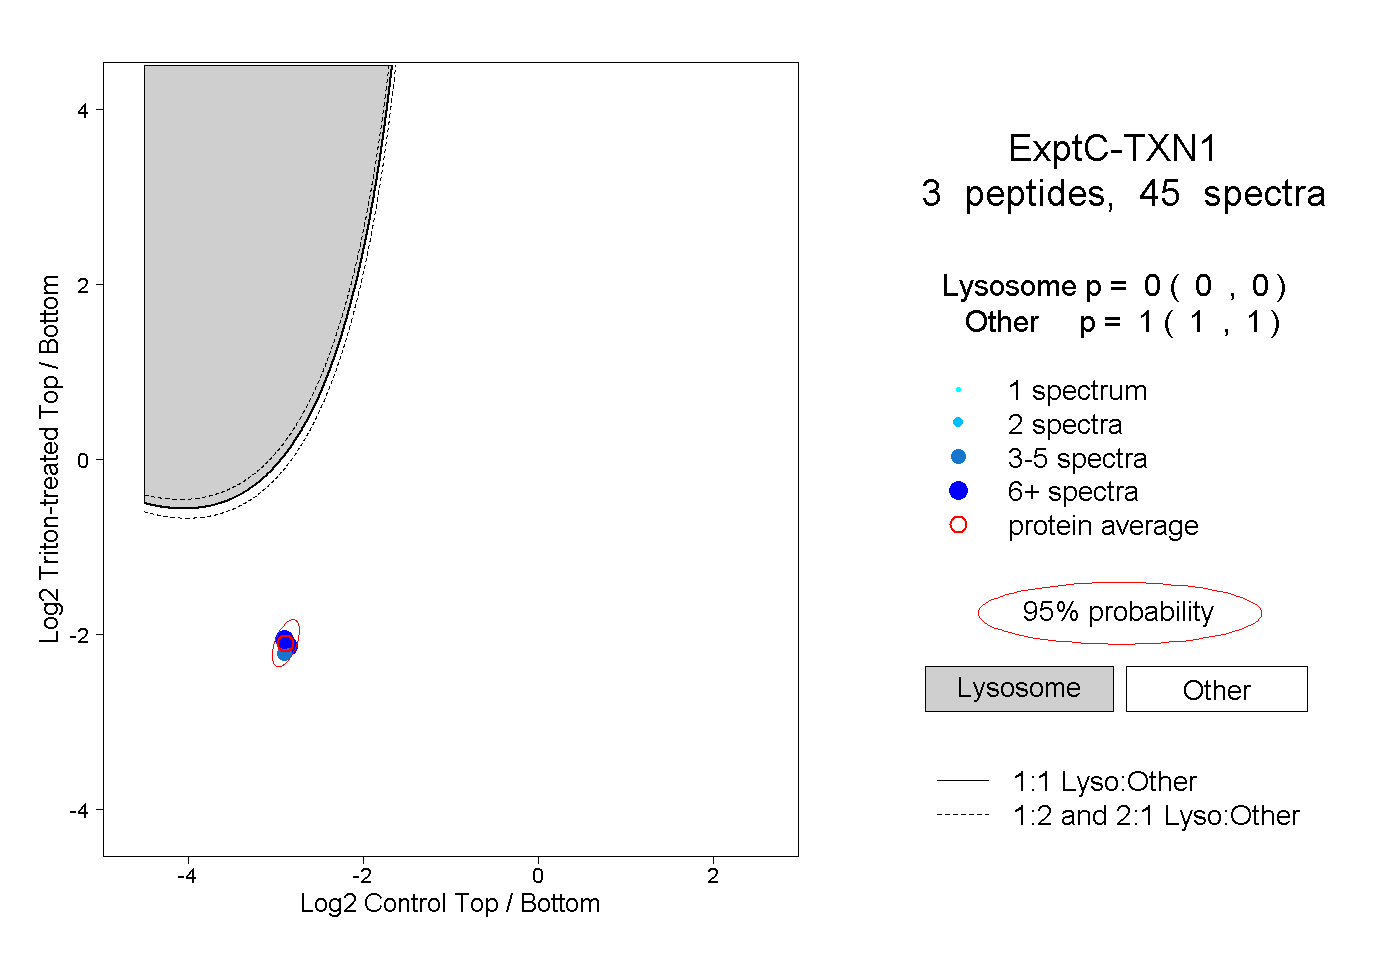
0.000 | 0.000
1.000 | 1.000