 4
4peptides
spectra
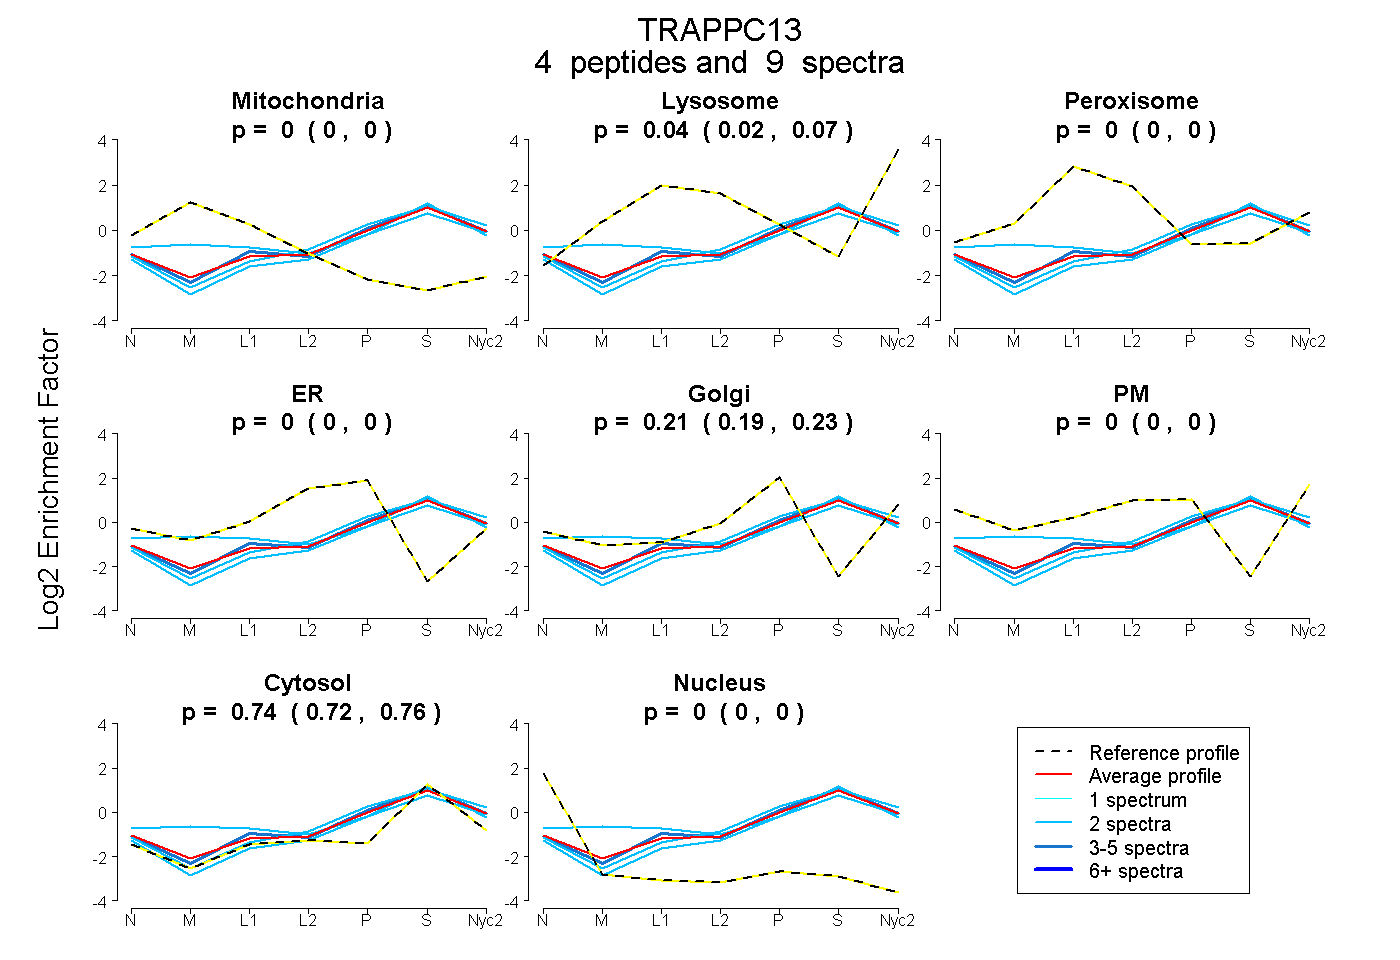
0.000 | 0.000
0.021 | 0.067
0.000 | 0.000
0.000 | 0.000
0.192 | 0.228
0.000 | 0.000
0.724 | 0.758
0.000 | 0.000
1peptide
spectrum
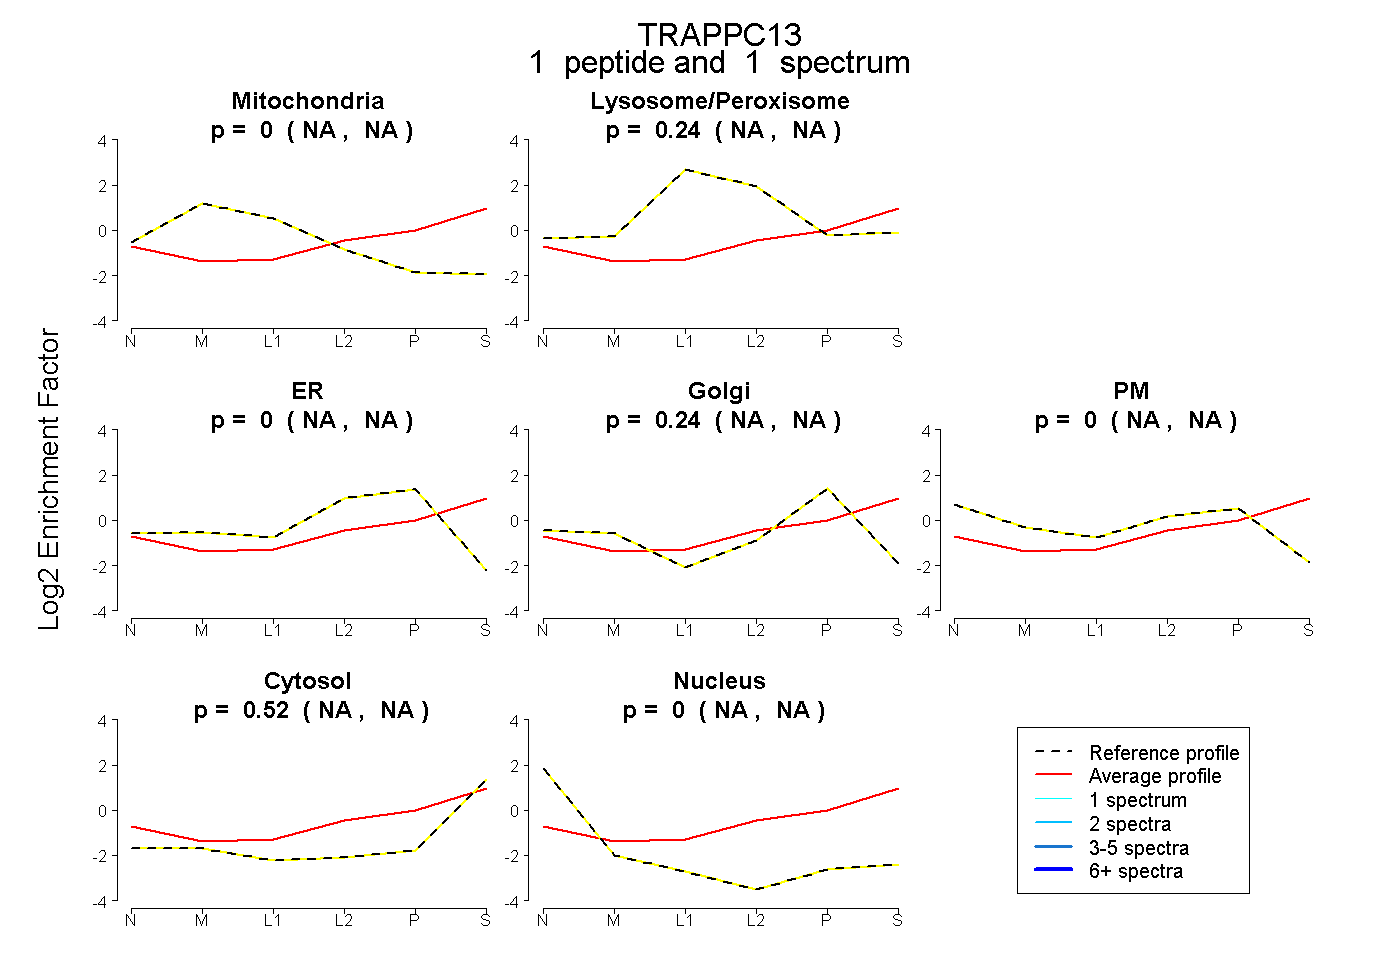
NA | NA
NA | NA
NA | NA
NA | NA
NA | NA
NA | NA
NA | NA
6peptides
spectra

0.000 | 0.000
1.000 | 1.000
1peptide
spectra
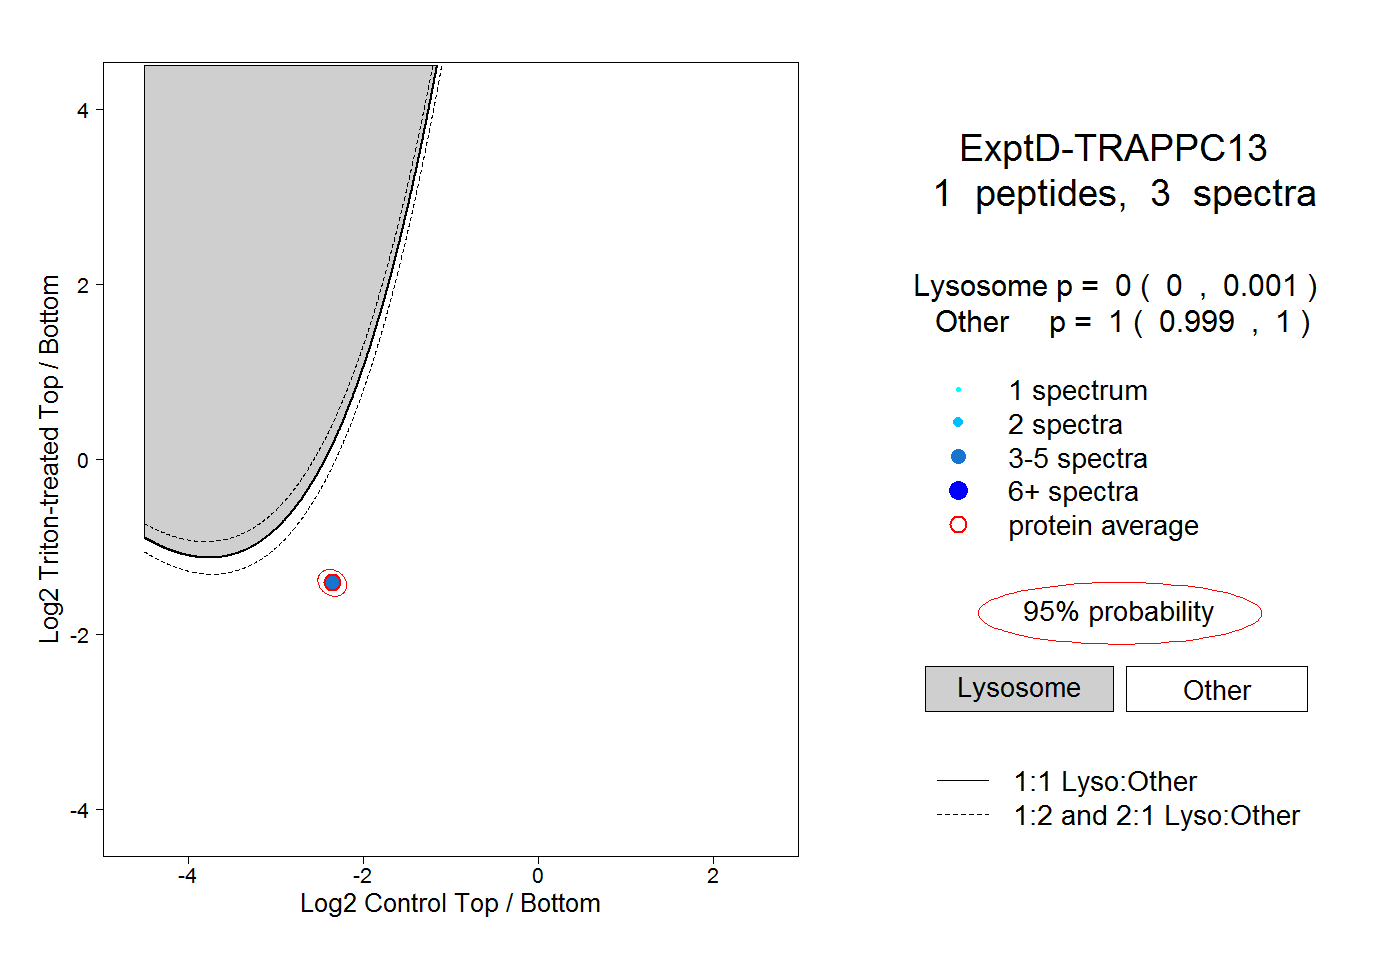
0.000 | 0.001
0.999 | 1.000