 31
31peptides
spectra
0.000 | 0.000
0.249 | 0.285
0.000 | 0.000
0.000 | 0.000
0.000 | 0.000
0.160 | 0.208
0.000 | 0.000
0.534 | 0.553
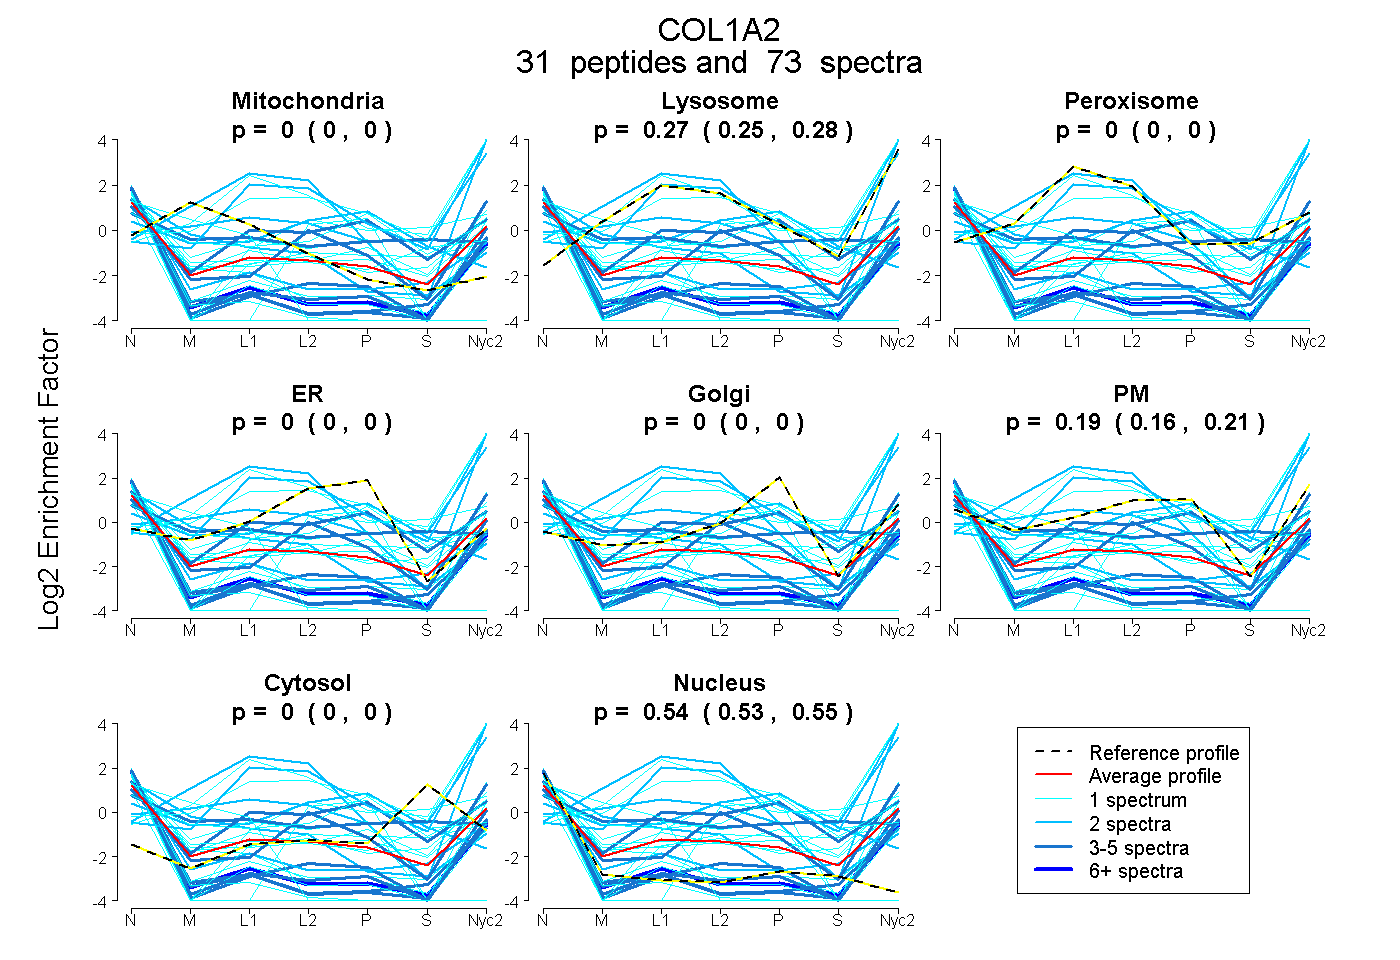
| Plot | Mito | Lyso | Perox | ER | Golgi | PM | Cytosol | Nucleus | |||||
| Expt A |
31 peptides |
73 spectra |
|
0.000 0.000 | 0.000 |
0.268 0.249 | 0.285 |
0.000 0.000 | 0.000 |
0.000 0.000 | 0.000 |
0.000 0.000 | 0.000 |
0.188 0.160 | 0.208 |
0.000 0.000 | 0.000 |
0.544 0.534 | 0.553 |
| 4 spectra, EGPVGLPGIDGRPGPIGPAGPR | 0.000 | 0.118 | 0.000 | 0.000 | 0.000 | 0.000 | 0.000 | 0.882 | ||
| 1 spectrum, GLPGIK | 0.000 | 0.110 | 0.000 | 0.000 | 0.000 | 0.463 | 0.048 | 0.378 | ||
| 1 spectrum, SGHPGPVGPAGVR | 0.019 | 0.000 | 0.000 | 0.000 | 0.167 | 0.513 | 0.212 | 0.088 | ||
| 2 spectra, AGEDGHPGKPGRPGER | 0.448 | 0.060 | 0.000 | 0.000 | 0.000 | 0.160 | 0.000 | 0.331 | ||
| 5 spectra, GLPGADGR | 0.000 | 0.106 | 0.000 | 0.000 | 0.000 | 0.000 | 0.000 | 0.894 | ||
| 1 spectrum, GELGPVGNPGPAGPAGPR | 0.000 | 0.000 | 0.000 | 0.000 | 0.000 | 0.424 | 0.563 | 0.012 | ||
| 1 spectrum, DGQPGHK | 0.000 | 0.000 | 0.000 | 0.000 | 0.000 | 0.397 | 0.240 | 0.363 | ||
| 1 spectrum, TIIEYK | 0.000 | 0.919 | 0.081 | 0.000 | 0.000 | 0.000 | 0.000 | 0.000 | ||
| 1 spectrum, TGPPGPSGITGPPGPPGAAGK | 0.000 | 0.000 | 0.000 | 0.000 | 0.000 | 0.346 | 0.244 | 0.409 | ||
| 1 spectrum, GDQGPVGR | 0.000 | 0.120 | 0.000 | 0.000 | 0.000 | 0.367 | 0.025 | 0.488 | ||
| 2 spectra, NSIAYLDEETGR | 0.000 | 0.871 | 0.000 | 0.000 | 0.000 | 0.129 | 0.000 | 0.000 | ||
| 1 spectrum, GPNGDAGRPGEPGLMGPR | 0.000 | 0.177 | 0.000 | 0.000 | 0.000 | 0.000 | 0.000 | 0.823 | ||
| 18 spectra, AGVMGPPGNR | 0.000 | 0.142 | 0.000 | 0.000 | 0.000 | 0.000 | 0.000 | 0.858 | ||
| 2 spectra, FTYTVLVDGCSK | 0.001 | 0.891 | 0.000 | 0.000 | 0.000 | 0.108 | 0.000 | 0.000 | ||
| 3 spectra, GLVGEPGPAGSK | 0.146 | 0.000 | 0.150 | 0.000 | 0.000 | 0.282 | 0.290 | 0.132 | ||
| 1 spectrum, GEIGNPGR | 0.000 | 0.162 | 0.000 | 0.000 | 0.000 | 0.035 | 0.000 | 0.804 | ||
| 3 spectra, GVSAGPGPMGLMGPR | 0.000 | 0.000 | 0.014 | 0.000 | 0.000 | 0.651 | 0.213 | 0.122 | ||
| 3 spectra, GSTGPAGVR | 0.000 | 0.053 | 0.000 | 0.000 | 0.000 | 0.129 | 0.000 | 0.819 | ||
| 4 spectra, GEAGNIGFPGPK | 0.000 | 0.000 | 0.000 | 0.000 | 0.000 | 0.273 | 0.000 | 0.727 | ||
| 1 spectrum, GVVGPQGAR | 0.000 | 0.086 | 0.081 | 0.000 | 0.000 | 0.169 | 0.251 | 0.413 | ||
| 1 spectrum, GLPGSPGNVGPAGK | 0.198 | 0.000 | 0.000 | 0.331 | 0.000 | 0.000 | 0.000 | 0.471 | ||
| 2 spectra, EMATQLAFMR | 0.000 | 0.738 | 0.000 | 0.000 | 0.000 | 0.073 | 0.109 | 0.080 | ||
| 1 spectrum, GEPGPAGSVGPVGAVGPR | 0.000 | 0.000 | 0.000 | 0.000 | 0.623 | 0.048 | 0.000 | 0.329 | ||
| 1 spectrum, GAAGIPGGK | 0.000 | 0.222 | 0.000 | 0.000 | 0.000 | 0.000 | 0.000 | 0.778 | ||
| 4 spectra, GPPGESGAAGPSGPIGSR | 0.000 | 0.000 | 0.000 | 0.000 | 0.000 | 0.644 | 0.000 | 0.356 | ||
| 1 spectrum, GPSGPQGIR | 0.000 | 0.070 | 0.000 | 0.000 | 0.000 | 0.000 | 0.000 | 0.930 | ||
| 1 spectrum, TGEIGASGPPGFAGEK | 0.526 | 0.000 | 0.000 | 0.000 | 0.000 | 0.000 | 0.000 | 0.474 | ||
| 2 spectra, GPAGPSGPIGK | 0.000 | 0.248 | 0.000 | 0.000 | 0.000 | 0.000 | 0.000 | 0.752 | ||
| 1 spectrum, LSHPEWK | 0.000 | 0.800 | 0.000 | 0.000 | 0.000 | 0.194 | 0.006 | 0.000 | ||
| 2 spectra, GIPGPVGAAGATGPR | 0.090 | 0.000 | 0.033 | 0.553 | 0.000 | 0.000 | 0.246 | 0.078 | ||
| 1 spectrum, GAPGPDGNNGAQGPPGPQGVQGGK | 0.000 | 0.000 | 0.000 | 0.000 | 0.000 | 0.000 | 0.000 | 1.000 |
| Plot | Mito | Lyso or Perox | ER | Golgi | PM | Cytosol | Nucleus | ||||||
| Expt B |
2 peptides |
2 spectra |
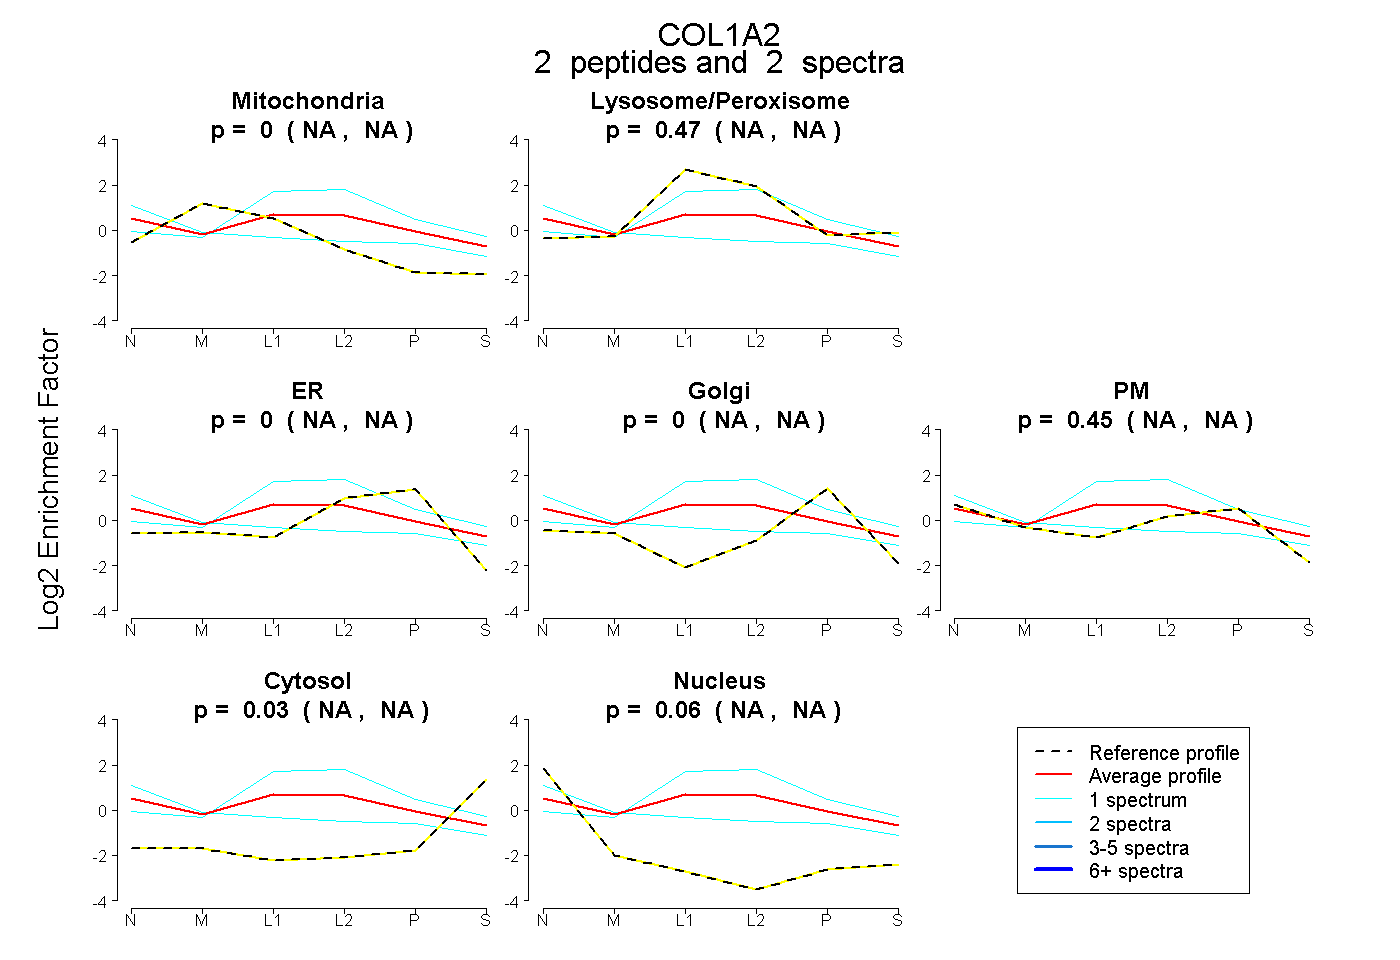 |
0.000 NA | NA |
0.469 NA | NA |
0.000 NA | NA |
0.000 NA | NA |
0.445 NA | NA |
0.028 NA | NA |
0.057 NA | NA |
|||
| Plot | Lyso | Other | |||||||||||
| Expt C |
28 peptides |
99 spectra |
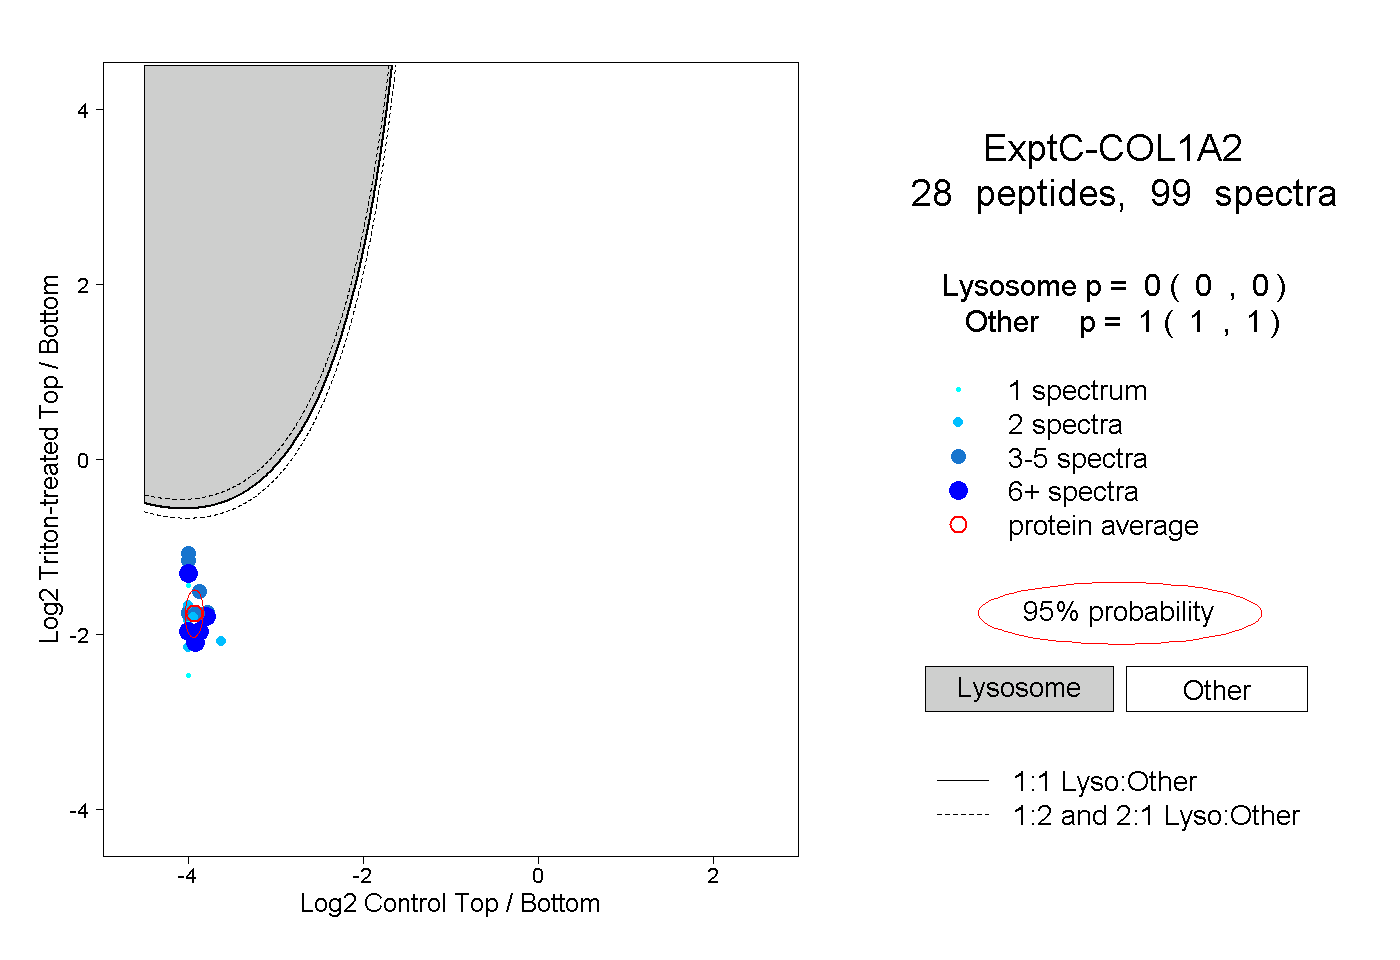 |
0.000 0.000 | 0.000 |
1.000 1.000 | 1.000 |
||||||||
| Plot | Lyso | Other | |||||||||||
| Expt D |
8 peptides |
9 spectra |
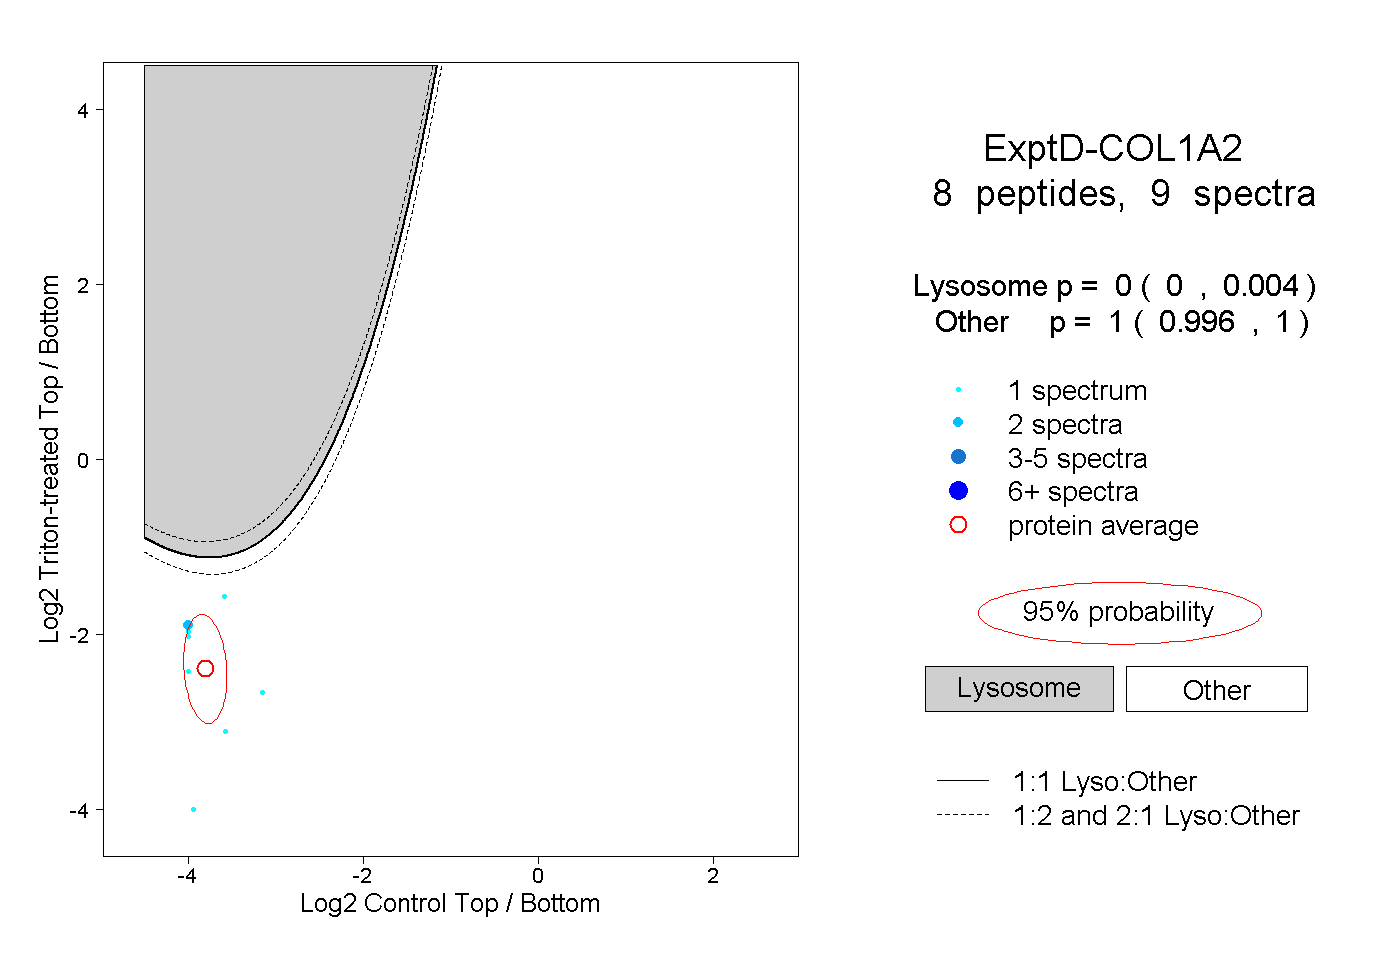 |
0.000 0.000 | 0.004 |
1.000 0.996 | 1.000 |