 6
6peptides
spectra
0.000 | 0.000
0.000 | 0.059
0.000 | 0.065
0.000 | 0.000
0.000 | 0.000
0.195 | 0.235
0.704 | 0.747
0.000 | 0.000
5peptides
spectra
0.000 | 0.957
0.043 | 1.000
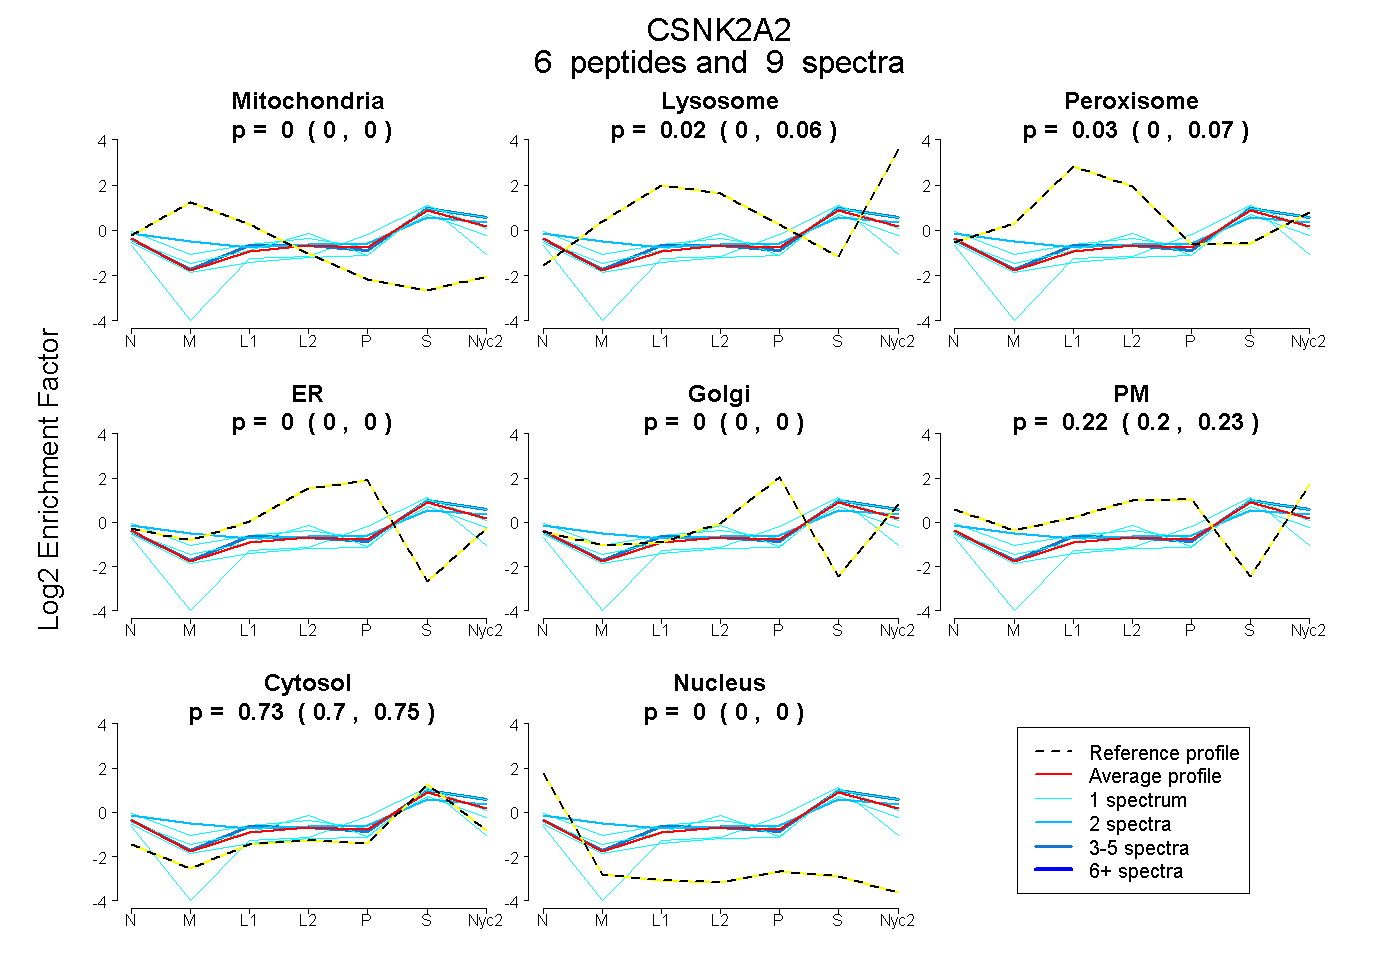
| Plot | Mito | Lyso | Perox | ER | Golgi | PM | Cytosol | Nucleus | |||||
| Expt A |
6 peptides |
9 spectra |
|
0.000 0.000 | 0.000 |
0.020 0.000 | 0.059 |
0.034 0.000 | 0.065 |
0.000 0.000 | 0.000 |
0.000 0.000 | 0.000 |
0.219 0.195 | 0.235 |
0.727 0.704 | 0.747 |
0.000 0.000 | 0.000 |
||
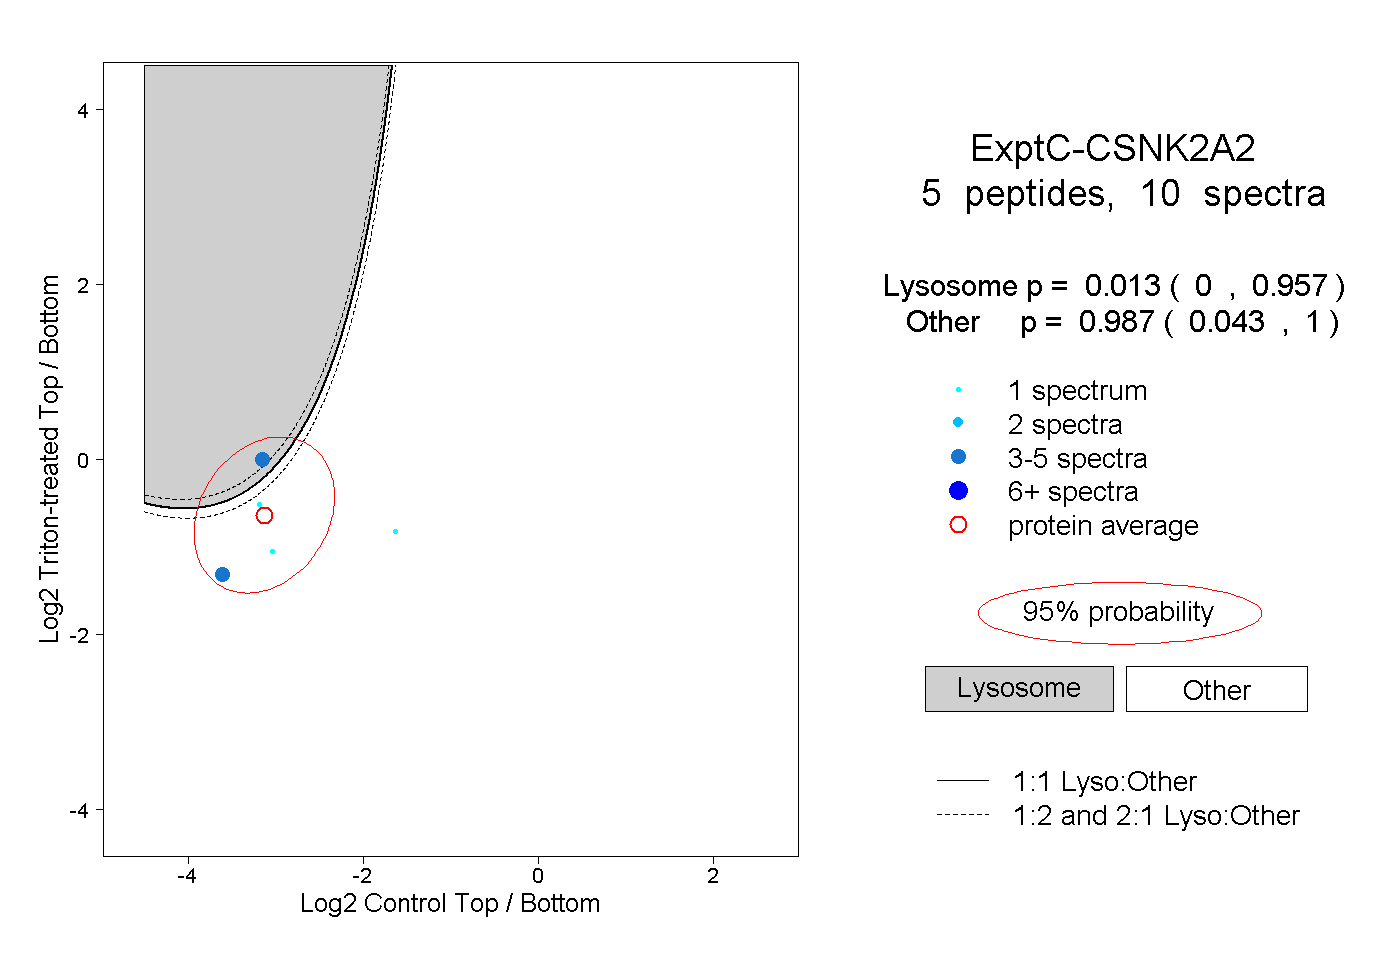
| Plot | Lyso | Other | |||||||||||
| Expt C |
5 peptides |
10 spectra |
|
0.013 0.000 | 0.957 |
0.987 0.043 | 1.000 |