 2
2peptides
spectra
0.000 | 0.000
0.000 | 0.000
0.000 | 0.052
0.187 | 0.280
0.000 | 0.025
0.000 | 0.011
0.689 | 0.748
0.000 | 0.029
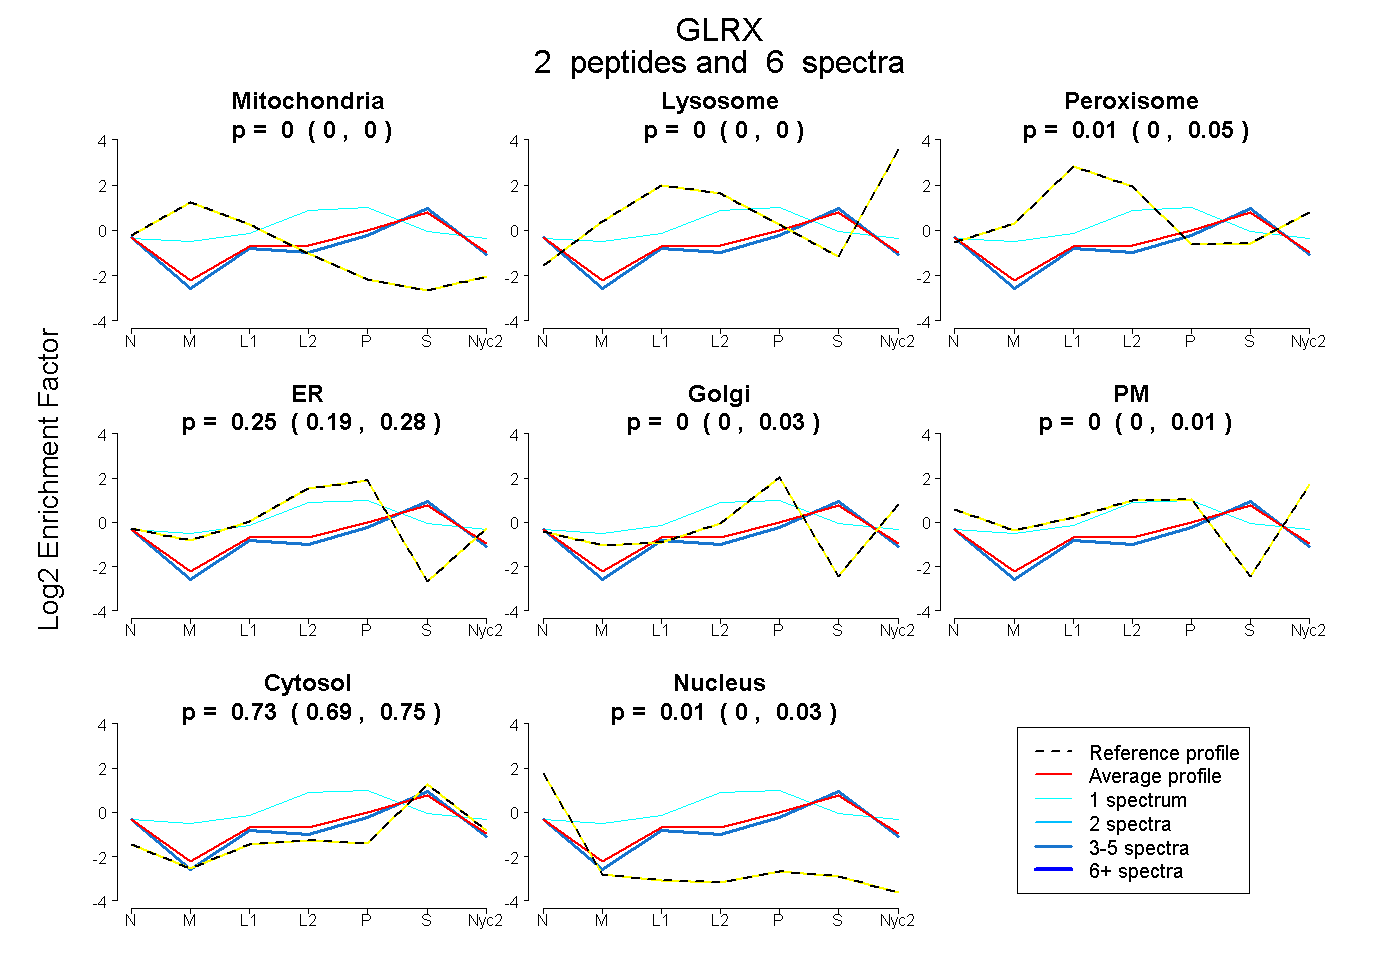
| Plot | Mito | Lyso | Perox | ER | Golgi | PM | Cytosol | Nucleus | |||||
| Expt A |
2 peptides |
6 spectra |
|
0.000 0.000 | 0.000 |
0.000 0.000 | 0.000 |
0.013 0.000 | 0.052 |
0.254 0.187 | 0.280 |
0.000 0.000 | 0.025 |
0.000 0.000 | 0.011 |
0.726 0.689 | 0.748 |
0.006 0.000 | 0.029 |
| 5 spectra, VVVFIKPTCPYCR | 0.000 | 0.000 | 0.000 | 0.187 | 0.000 | 0.000 | 0.782 | 0.031 | ||
| 1 spectrum, DCIGGCSDLLSMQQNGELTAR | 0.000 | 0.000 | 0.209 | 0.467 | 0.005 | 0.000 | 0.319 | 0.000 |
| Plot | Lyso | Other | |||||||||||
| Expt C |
2 peptides |
4 spectra |
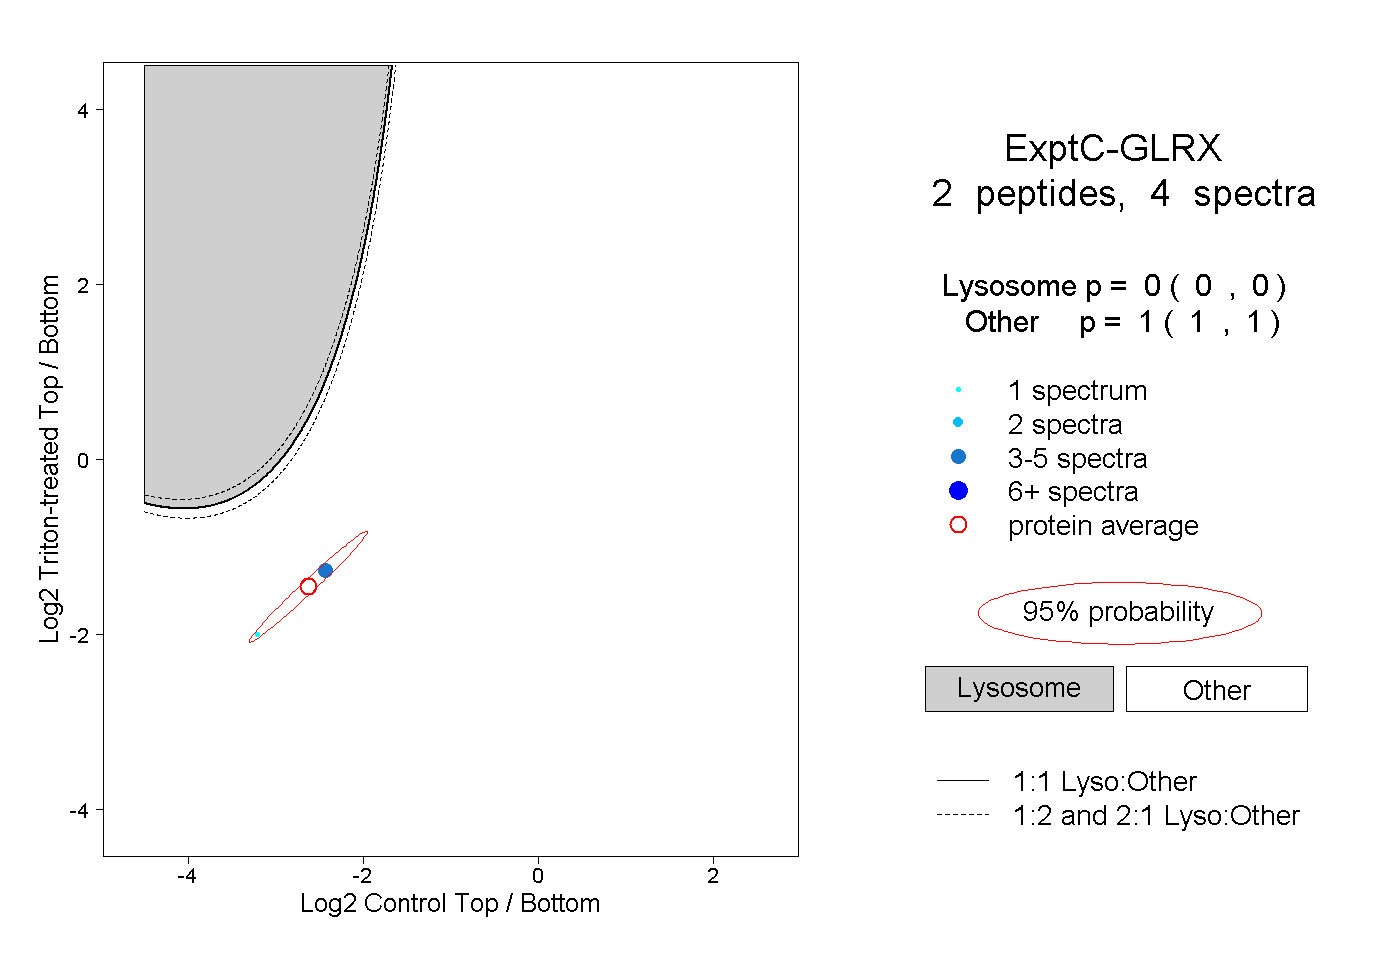 |
0.000 0.000 | 0.000 |
1.000 1.000 | 1.000 |