 2
2peptides
spectra
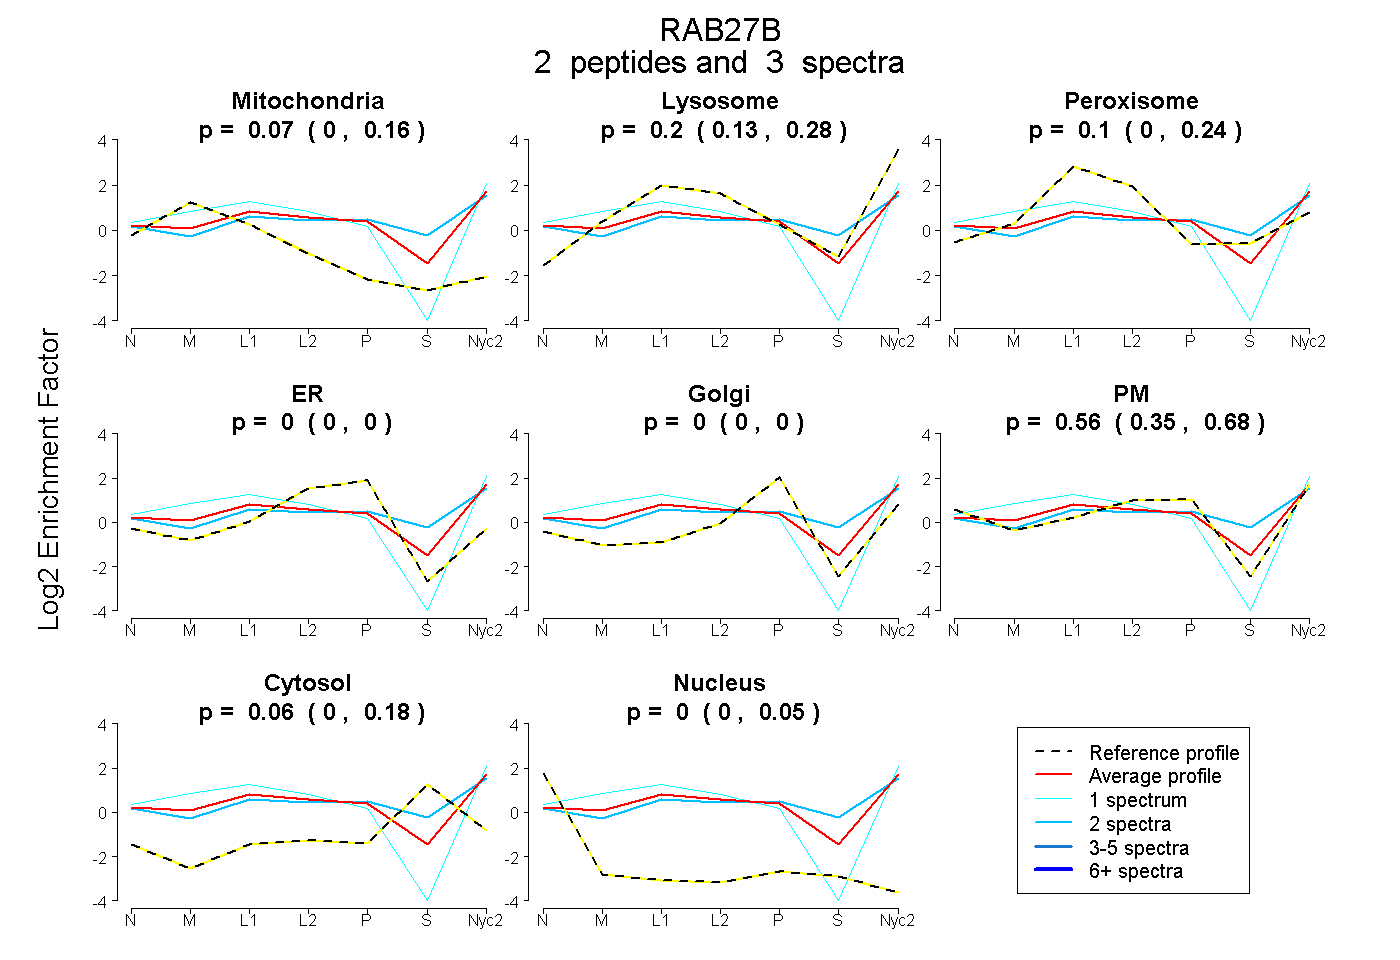
0.000 | 0.160
0.128 | 0.276
0.000 | 0.237
0.000 | 0.000
0.000 | 0.000
0.351 | 0.677
0.000 | 0.182
0.000 | 0.054
1peptide
spectra
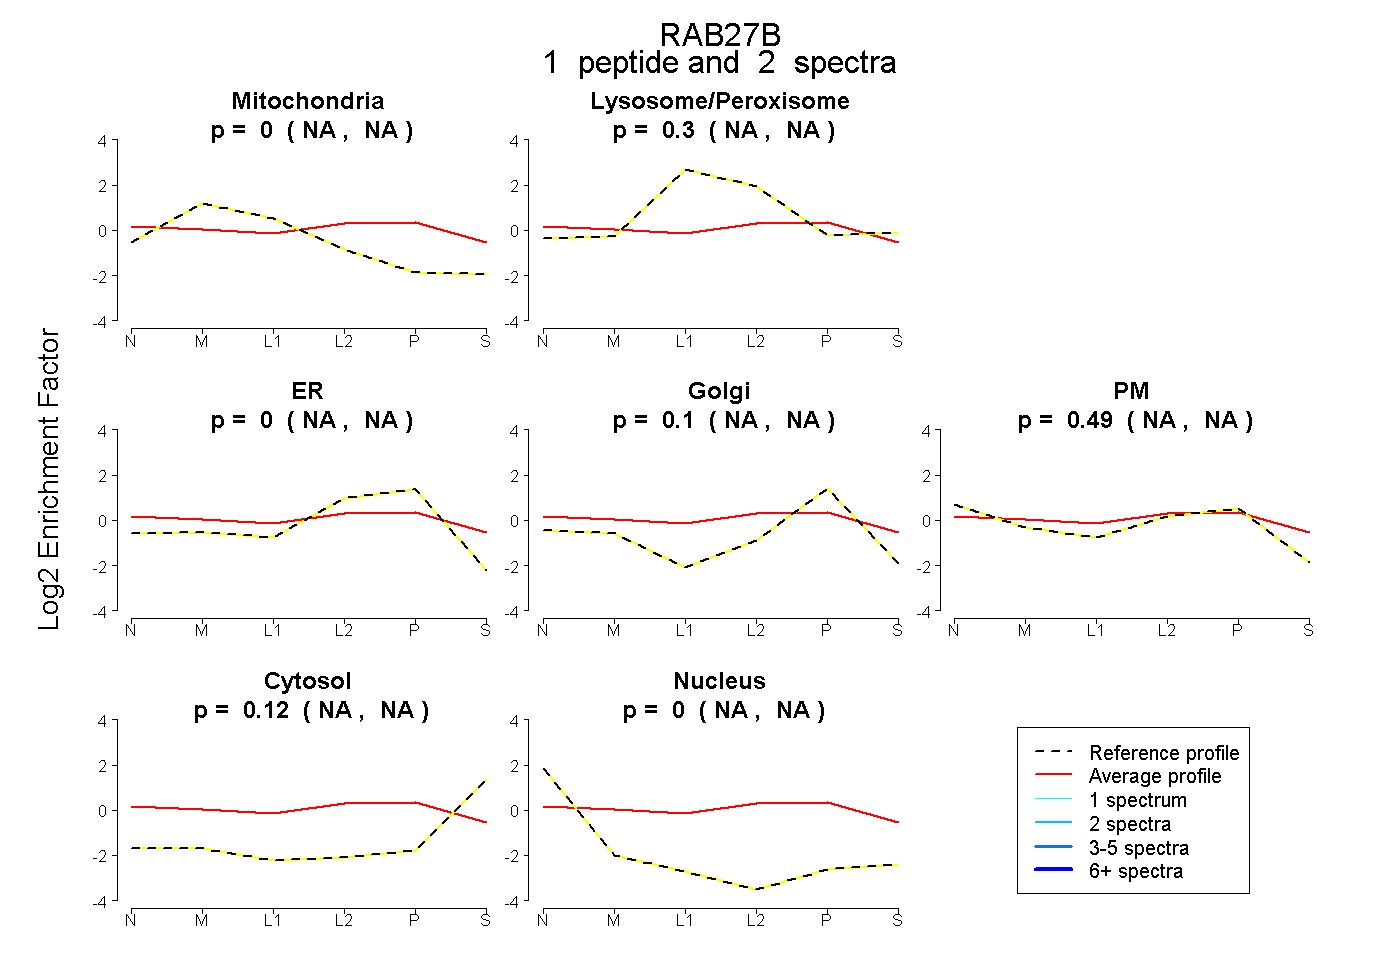
NA | NA
NA | NA
NA | NA
NA | NA
NA | NA
NA | NA
NA | NA
2peptides
spectra
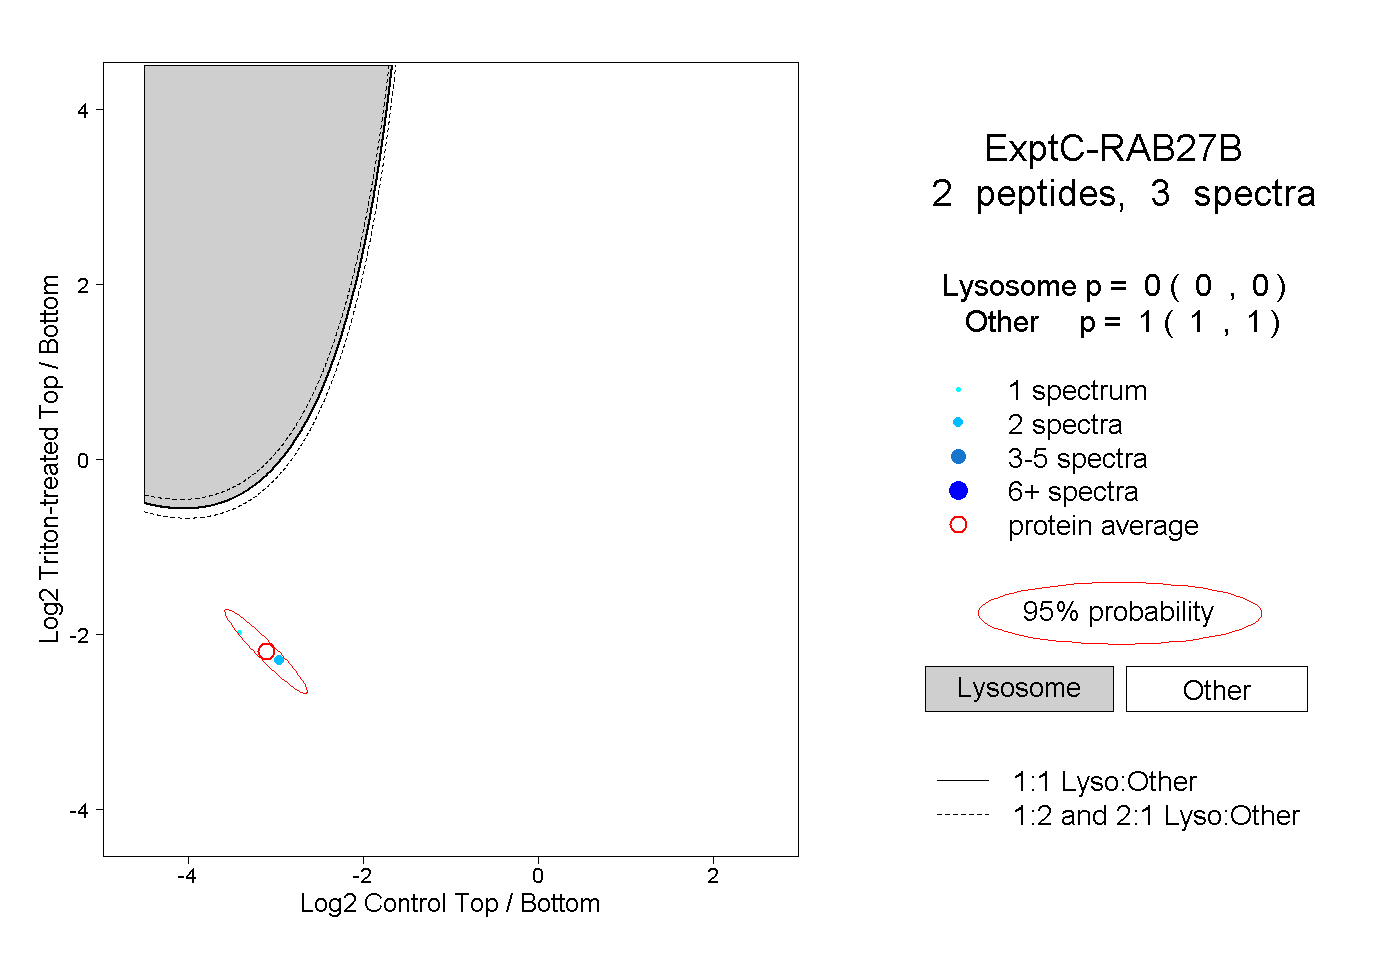
0.000 | 0.000
1.000 | 1.000