13
13peptides
spectra
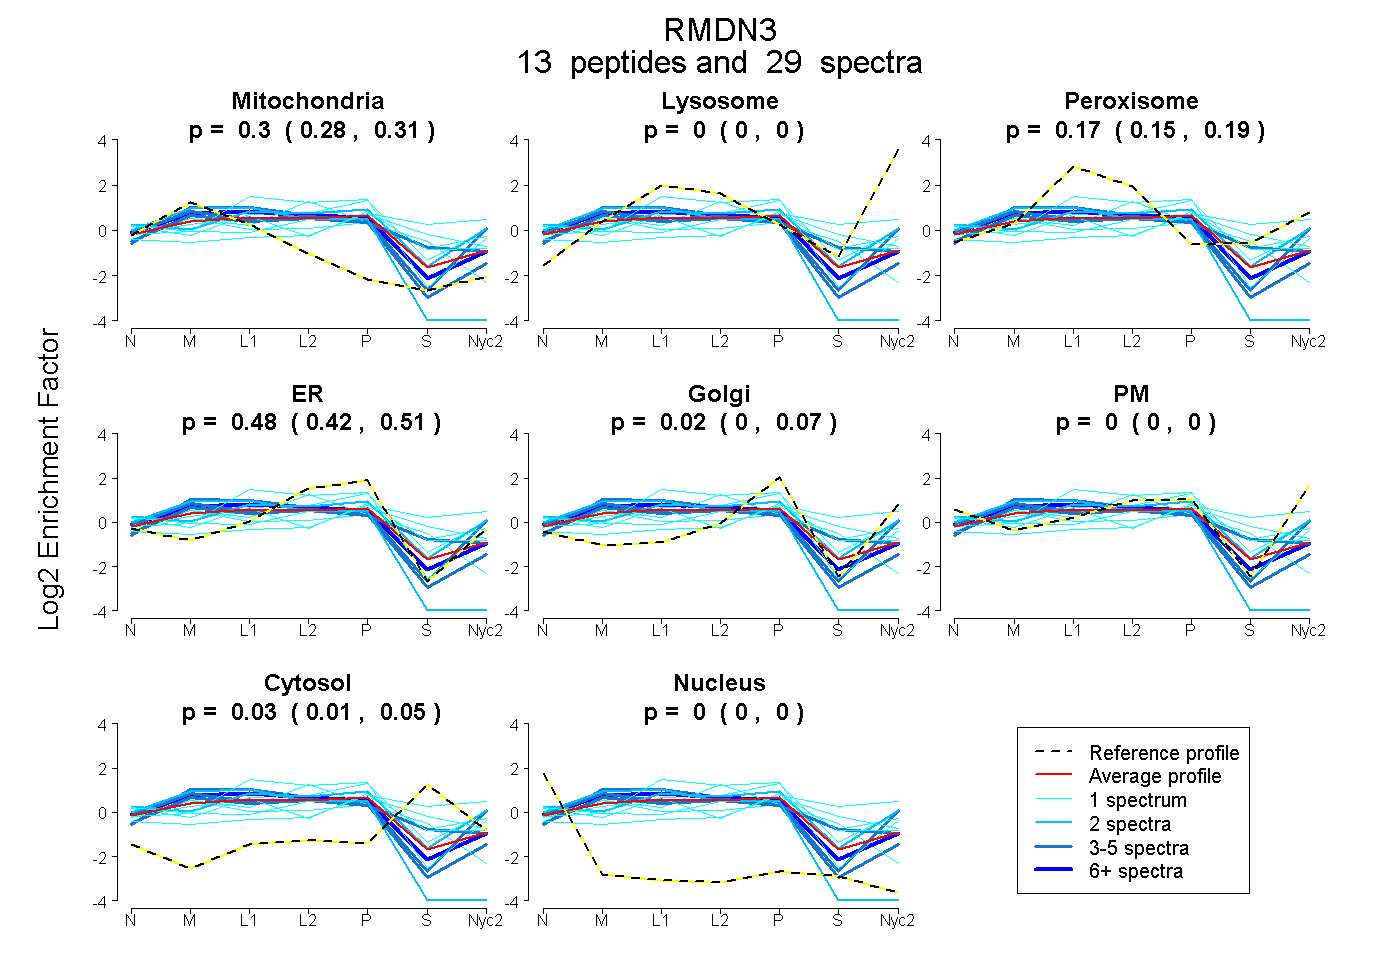
0.278 | 0.310
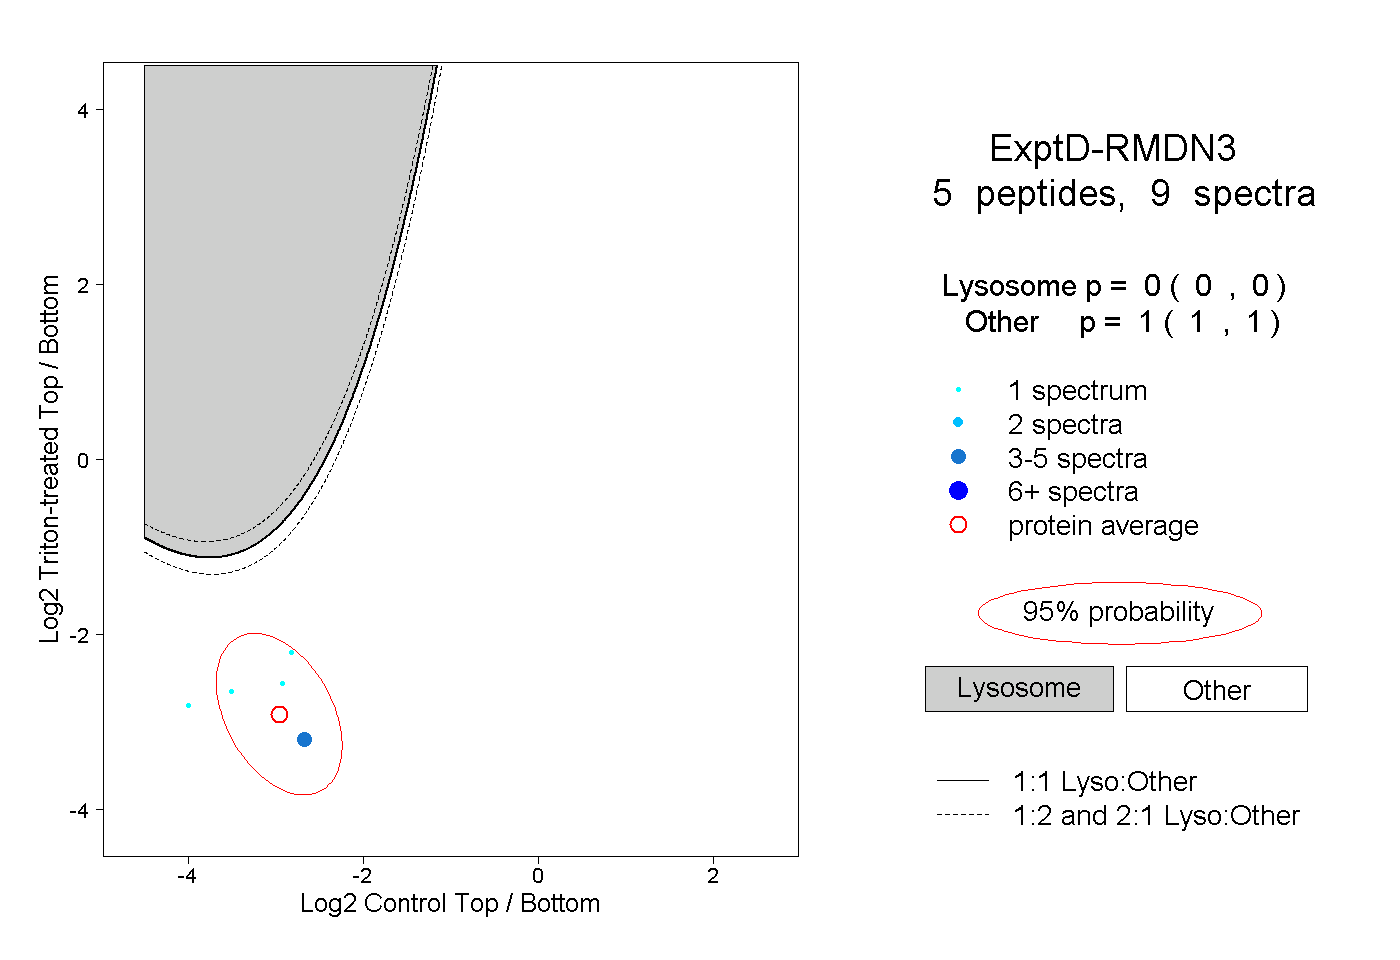
0.000 | 0.000
0.150 | 0.192
0.422 | 0.508
0.000 | 0.068
0.000 | 0.000
0.011 | 0.047
0.000 | 0.000
8peptides
spectra
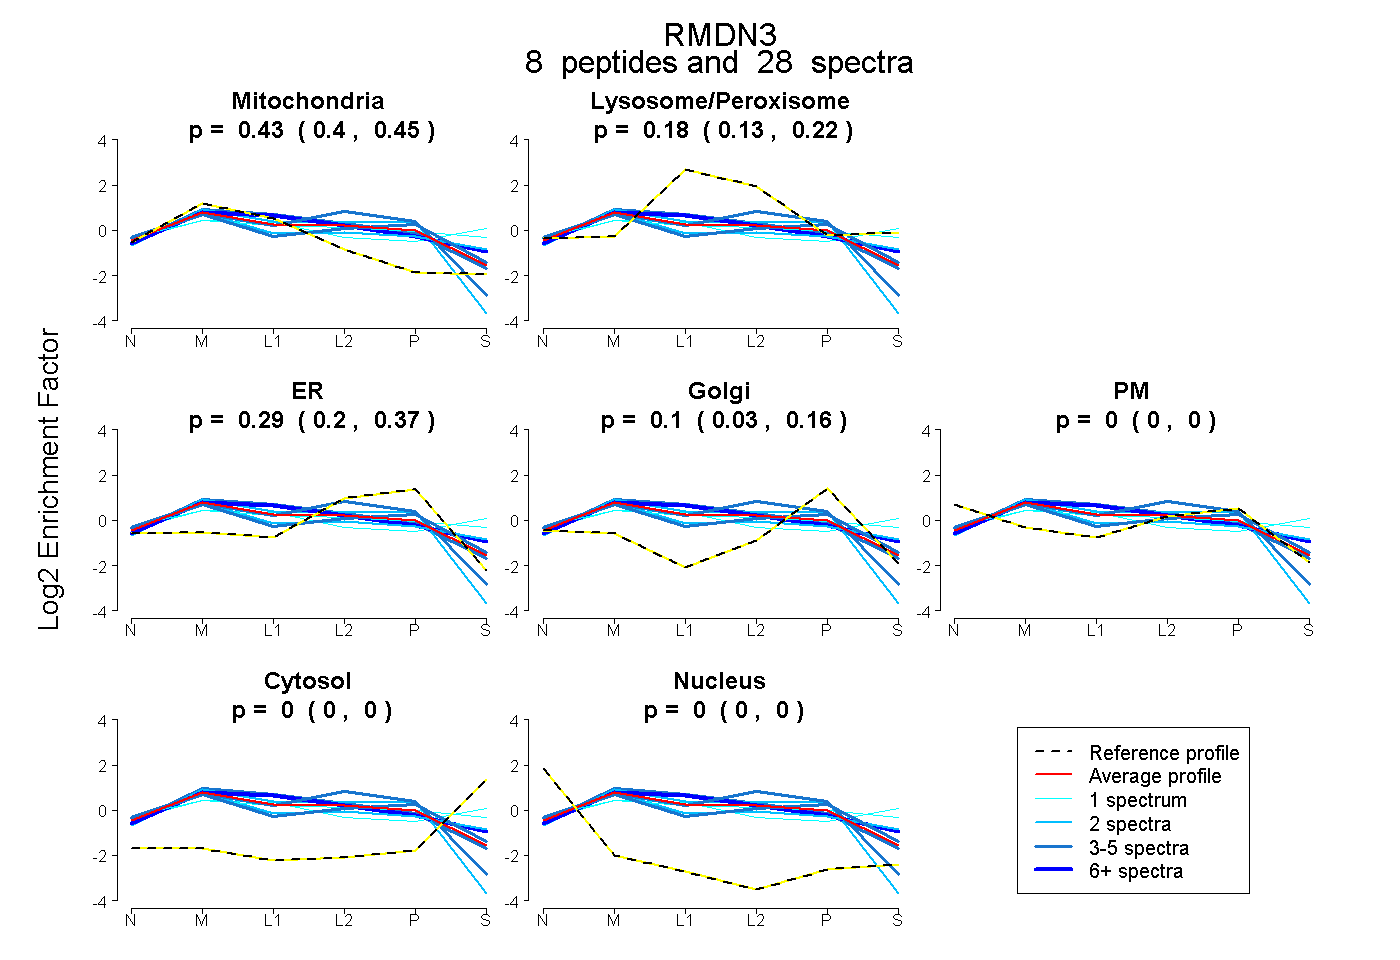
0.401 | 0.454
0.126 | 0.217
0.202 | 0.371
0.032 | 0.165
0.000 | 0.000
0.000 | 0.000
0.000 | 0.000