 1
1peptide
spectra
0.579 | 0.785
0.000 | 0.265
0.000 | 0.000
0.000 | 0.000
0.000 | 0.000
0.000 | 0.287
0.000 | 0.089
0.000 | 0.084
2peptides
spectra
0.000 | 1.000
0.000 | 1.000
| Plot | Mito | Lyso | Perox | ER | Golgi | PM | Cytosol | Nucleus | |||||
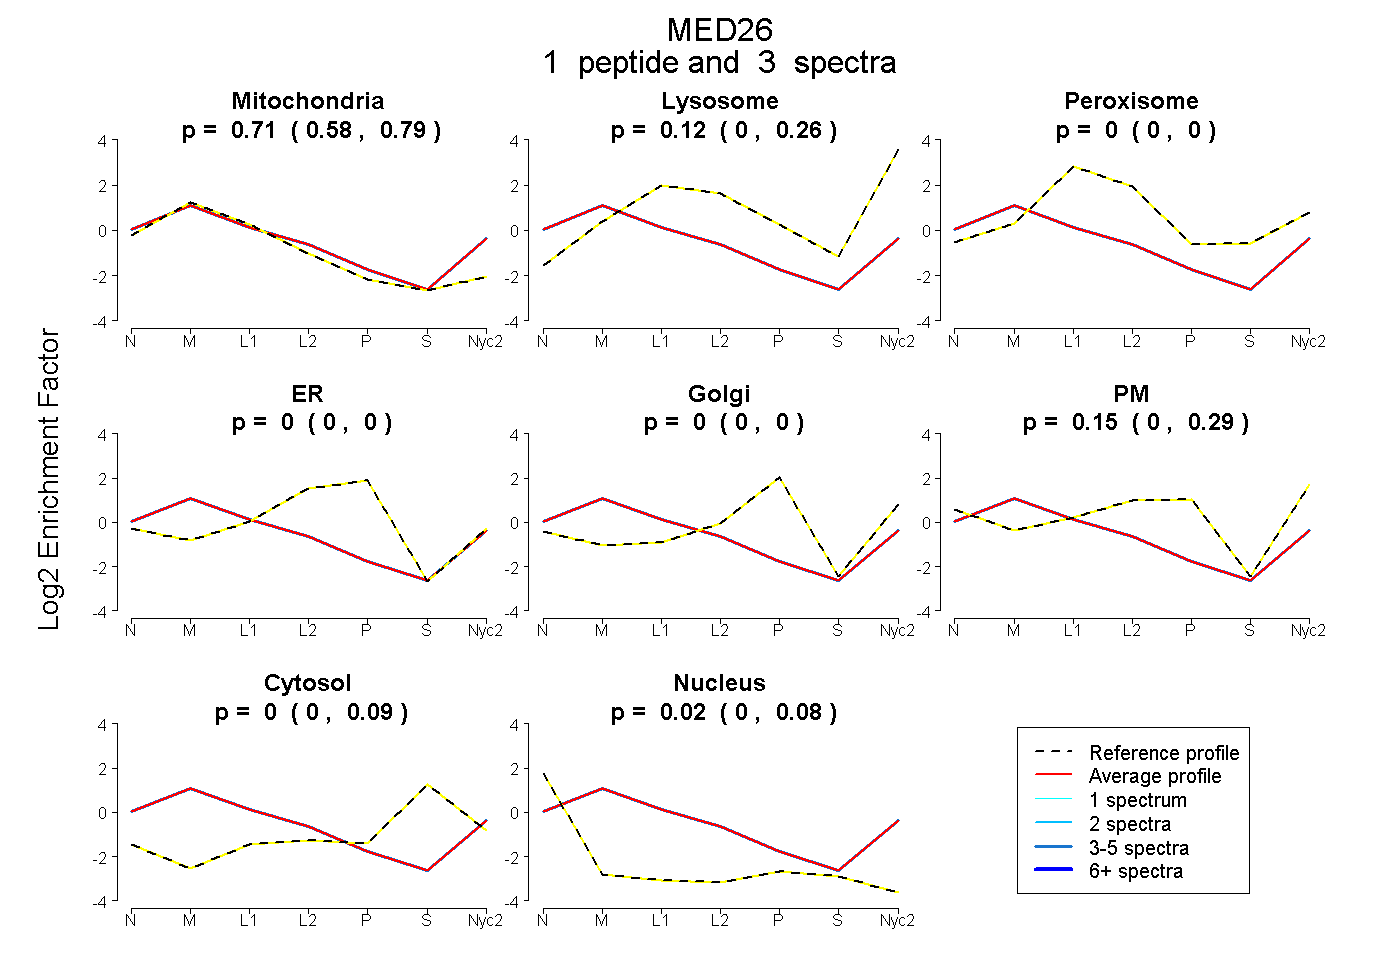
| Expt A |
1 peptide |
3 spectra |
|
0.705 0.579 | 0.785 |
0.119 0.000 | 0.265 |
0.000 0.000 | 0.000 |
0.000 0.000 | 0.000 |
0.000 0.000 | 0.000 |
0.151 0.000 | 0.287 |
0.000 0.000 | 0.089 |
0.025 0.000 | 0.084 |
||
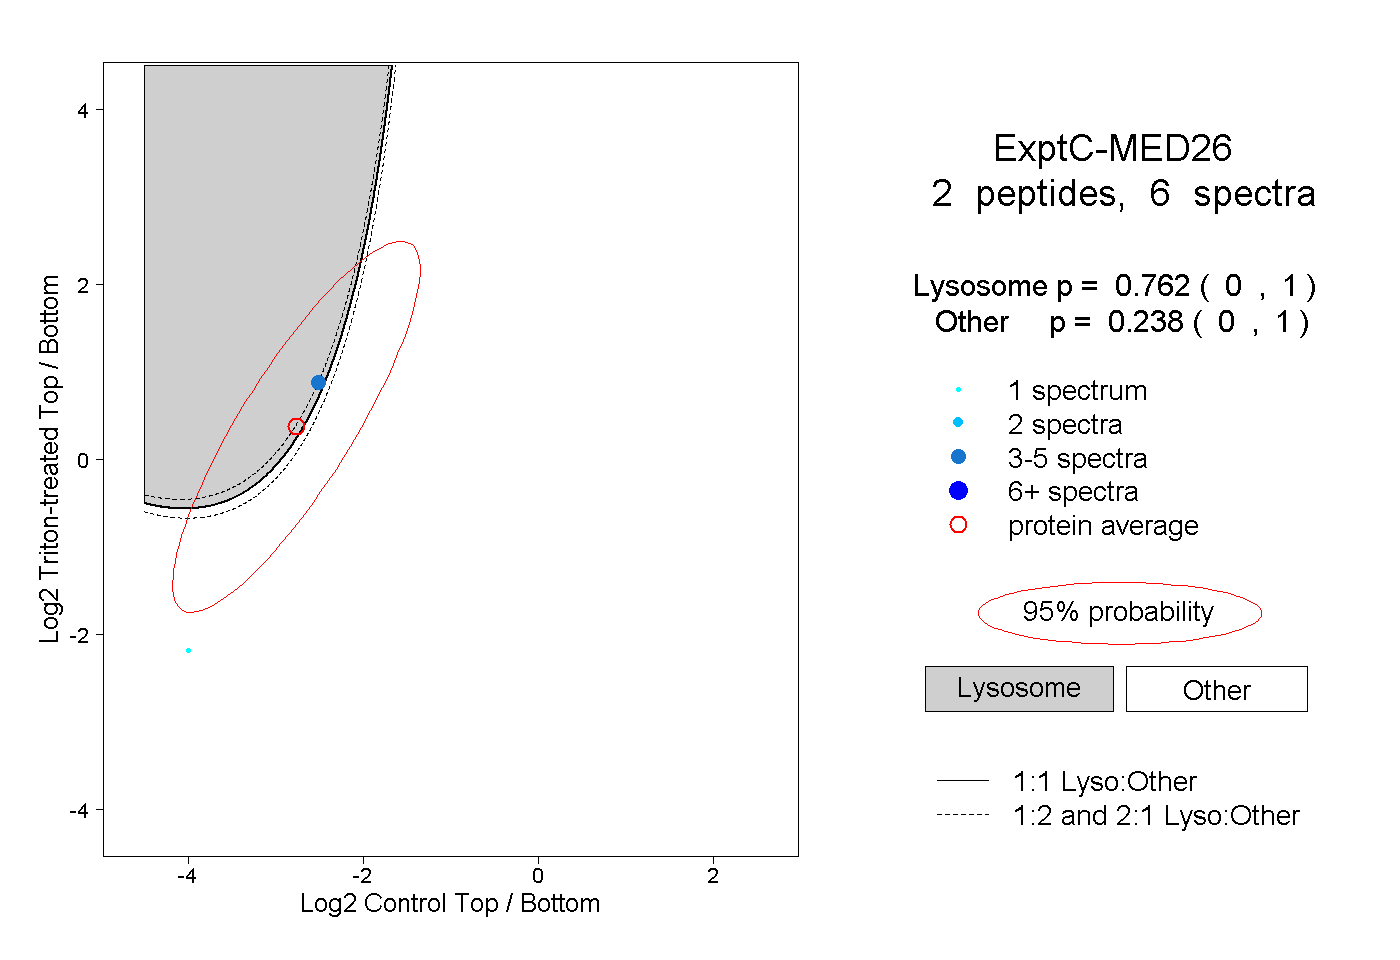
| Plot | Lyso | Other | |||||||||||
| Expt C |
2 peptides |
6 spectra |
|
0.762 0.000 | 1.000 |
0.238 0.000 | 1.000 |