GOLGA2
[ENSRNOP00000016341]
Main page
| | | Plot |
Mito |
Lyso |
|
Perox |
ER |
Golgi |
PM |
Cytosol |
Nucleus |
|
| Expt A |
 18
18
peptides |
34
spectra |
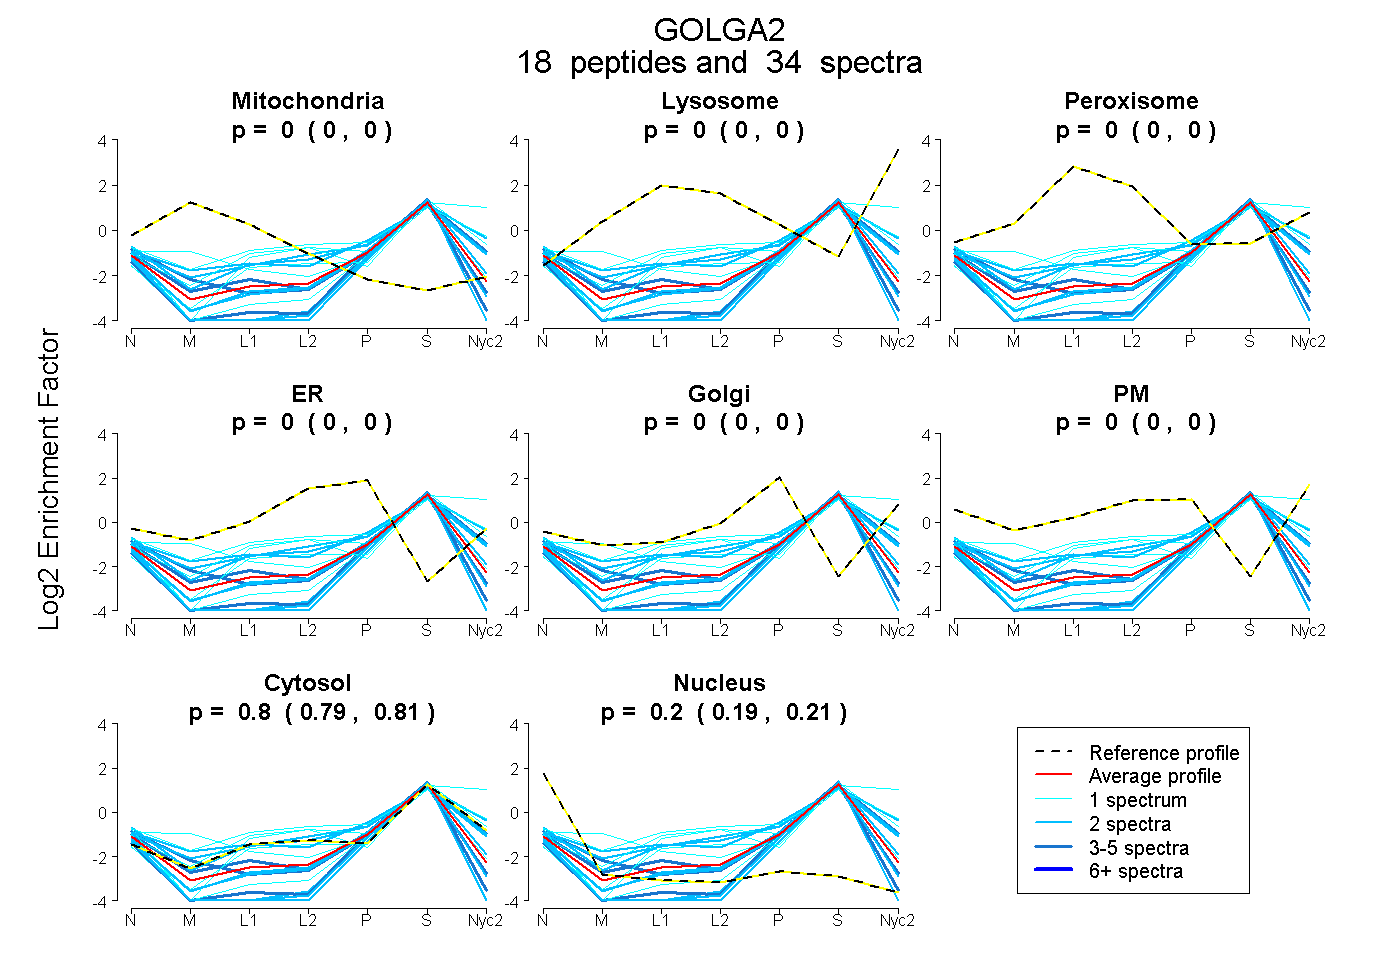 |
0.000
0.000 | 0.000 |
0.000
0.000 | 0.000 |
|
0.000
0.000 | 0.000 |
0.000
0.000 | 0.000 |
0.000
0.000 | 0.000 |
0.000
0.000 | 0.000 |
0.803
0.793 | 0.811 |
0.197
0.188 | 0.205 |
|
| | | Plot |
Mito |
|
Lyso or Perox |
|
ER |
Golgi |
PM |
Cytosol |
Nucleus |
|
| Expt B |
4
peptides |
5
spectra |
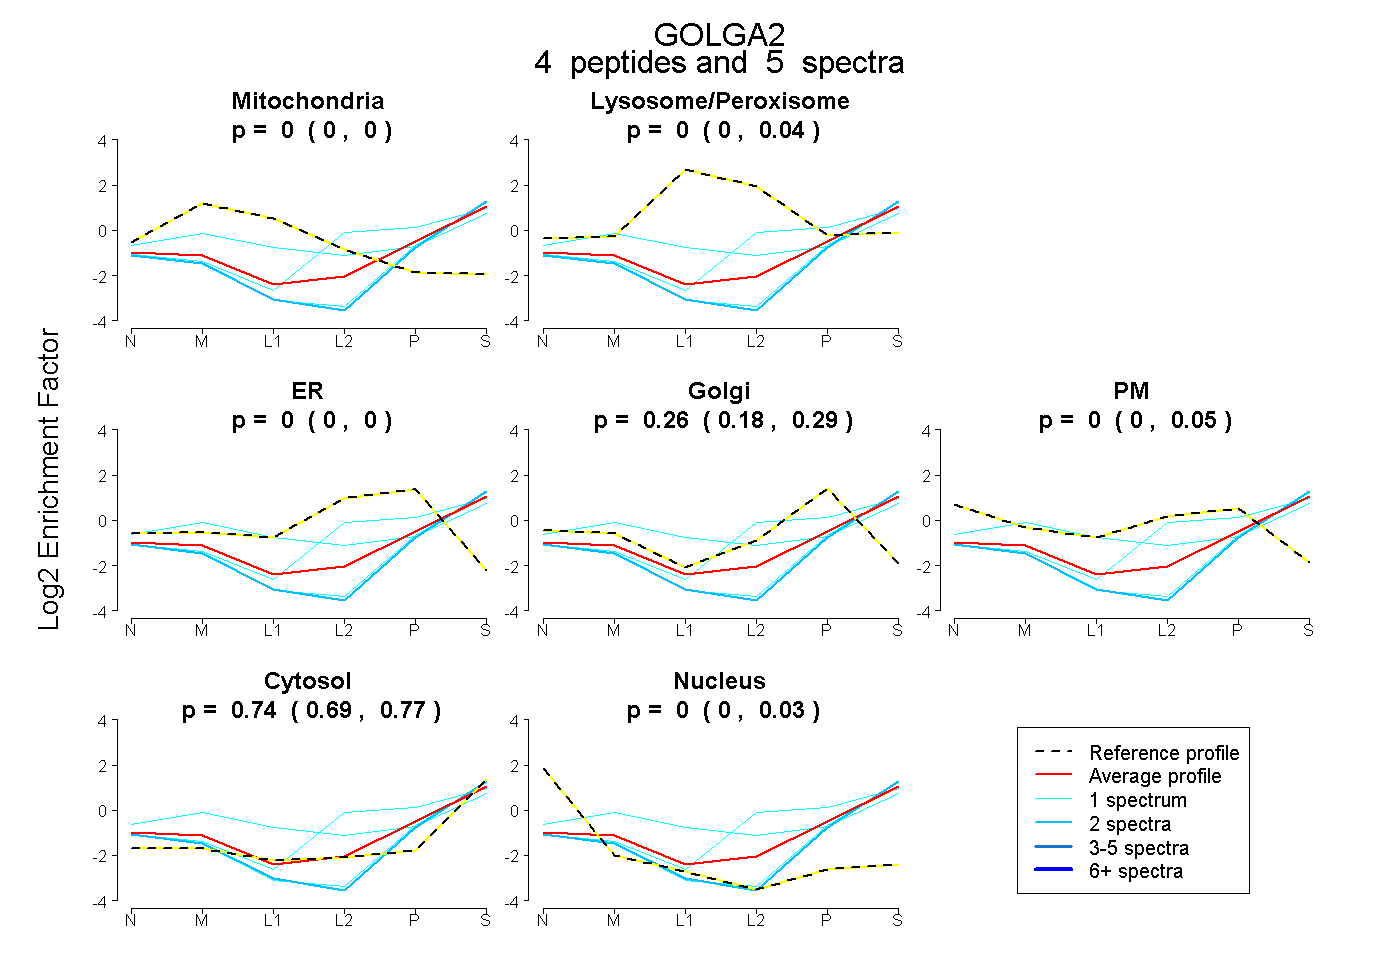 |
0.000
0.000 | 0.000 |
|
0.000
0.000 | 0.037 |
|
0.000
0.000 | 0.000 |
0.264
0.176 | 0.291 |
0.000
0.000 | 0.051 |
0.736
0.688 | 0.766 |
0.000
0.000 | 0.032 |
|
| 1 spectrum, LLELQELVLR |
0.000 |
|
0.000 |
|
0.360 |
0.020 |
0.000 |
0.620 |
0.000 |
|
| 1 spectrum, LQGEVEQLQK |
0.137 |
|
0.189 |
|
0.000 |
0.058 |
0.100 |
0.516 |
0.000 |
|
| 2 spectra, VGELER |
0.000 |
|
0.000 |
|
0.000 |
0.049 |
0.000 |
0.831 |
0.120 |
|
| 1 spectrum, AGESEDLASR |
0.000 |
|
0.000 |
|
0.000 |
0.084 |
0.000 |
0.816 |
0.100 |
|
| | | Plot |
|
Lyso |
|
|
|
|
|
|
|
Other |
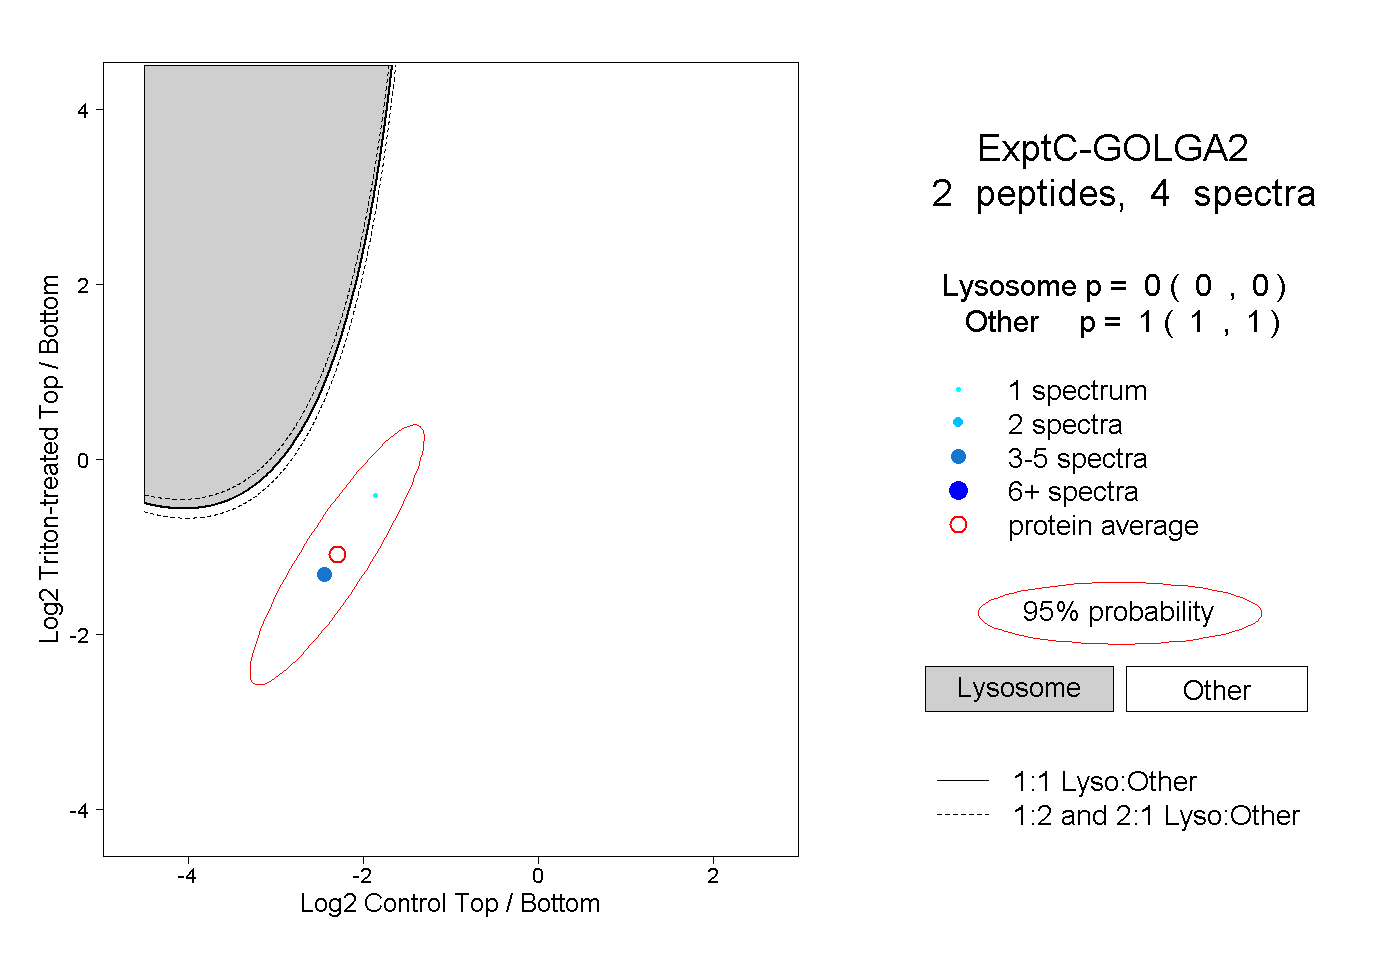
| Expt C |
2
peptides |
4
spectra |
 |
|
0.000
0.000 | 0.000 |
|
|
|
|
|
|
|
1.000
1.000 | 1.000 |