 18
18peptides
spectra
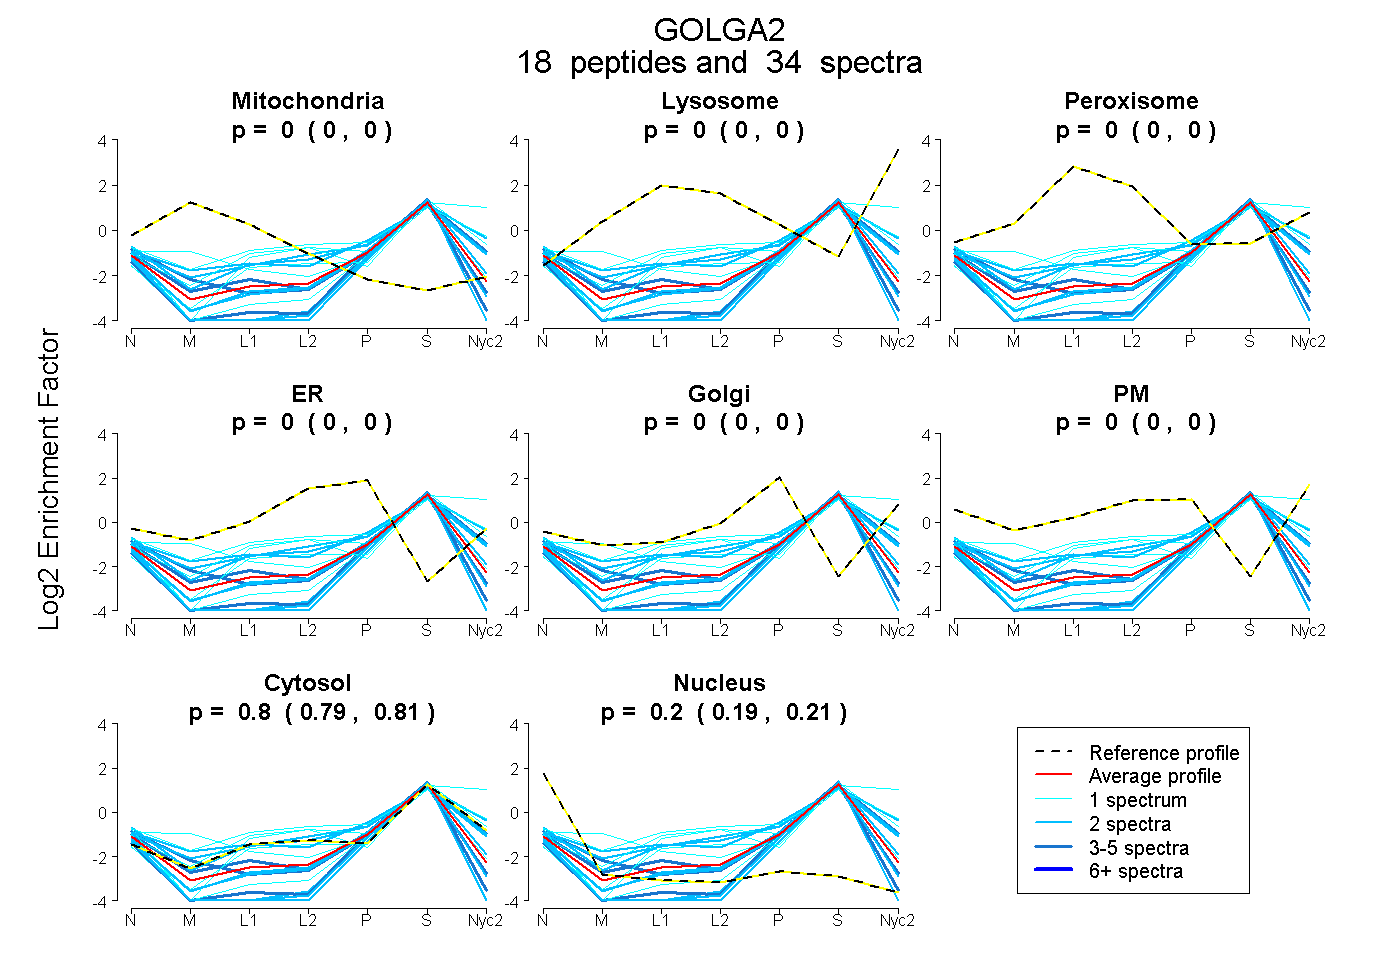
0.000 | 0.000
0.000 | 0.000
0.000 | 0.000
0.000 | 0.000
0.000 | 0.000
0.000 | 0.000
0.793 | 0.811
0.188 | 0.205
4peptides
spectra
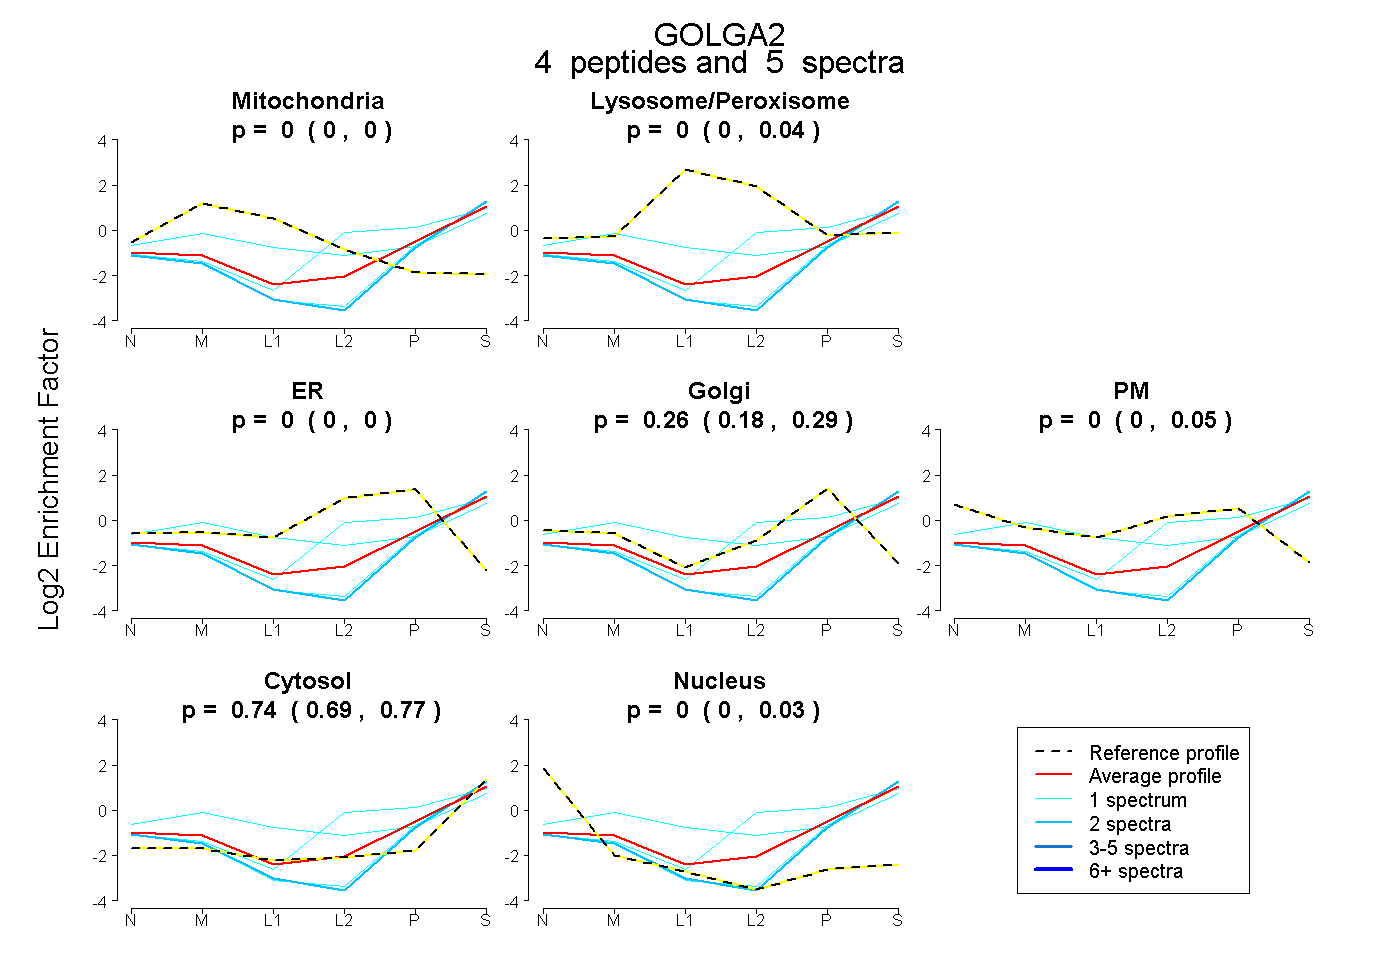
0.000 | 0.000
0.000 | 0.037
0.000 | 0.000
0.176 | 0.291
0.000 | 0.051
0.688 | 0.766
0.000 | 0.032
2peptides
spectra
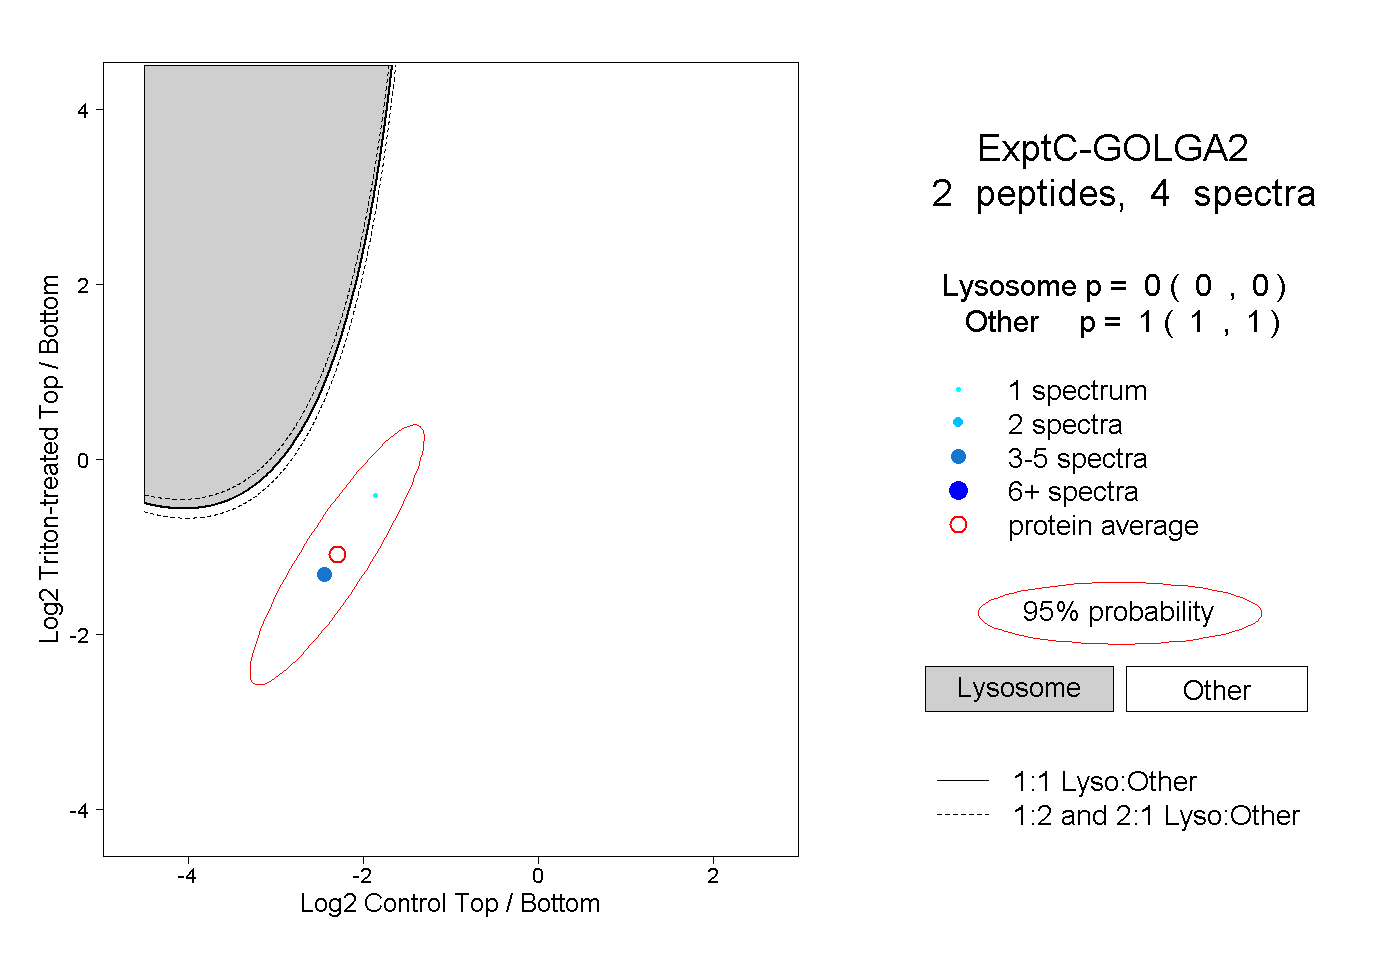
0.000 | 0.000
1.000 | 1.000