9
9peptides
spectra
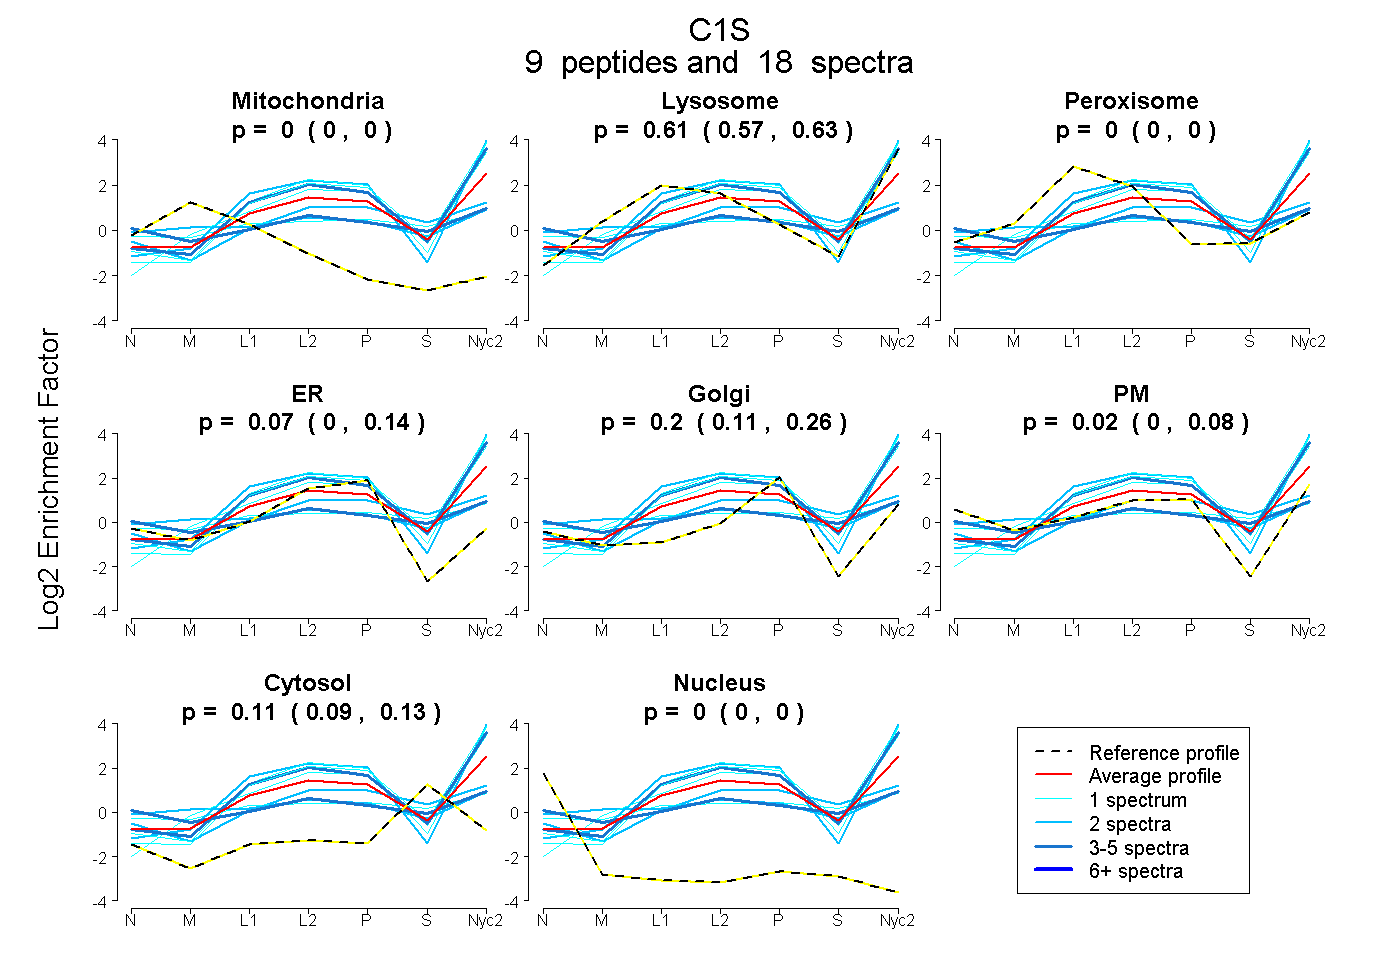
0.000 | 0.000
0.570 | 0.633
0.000 | 0.000
0.000 | 0.139
0.110 | 0.255
0.000 | 0.077
0.090 | 0.132
0.000 | 0.000
4peptides
spectra
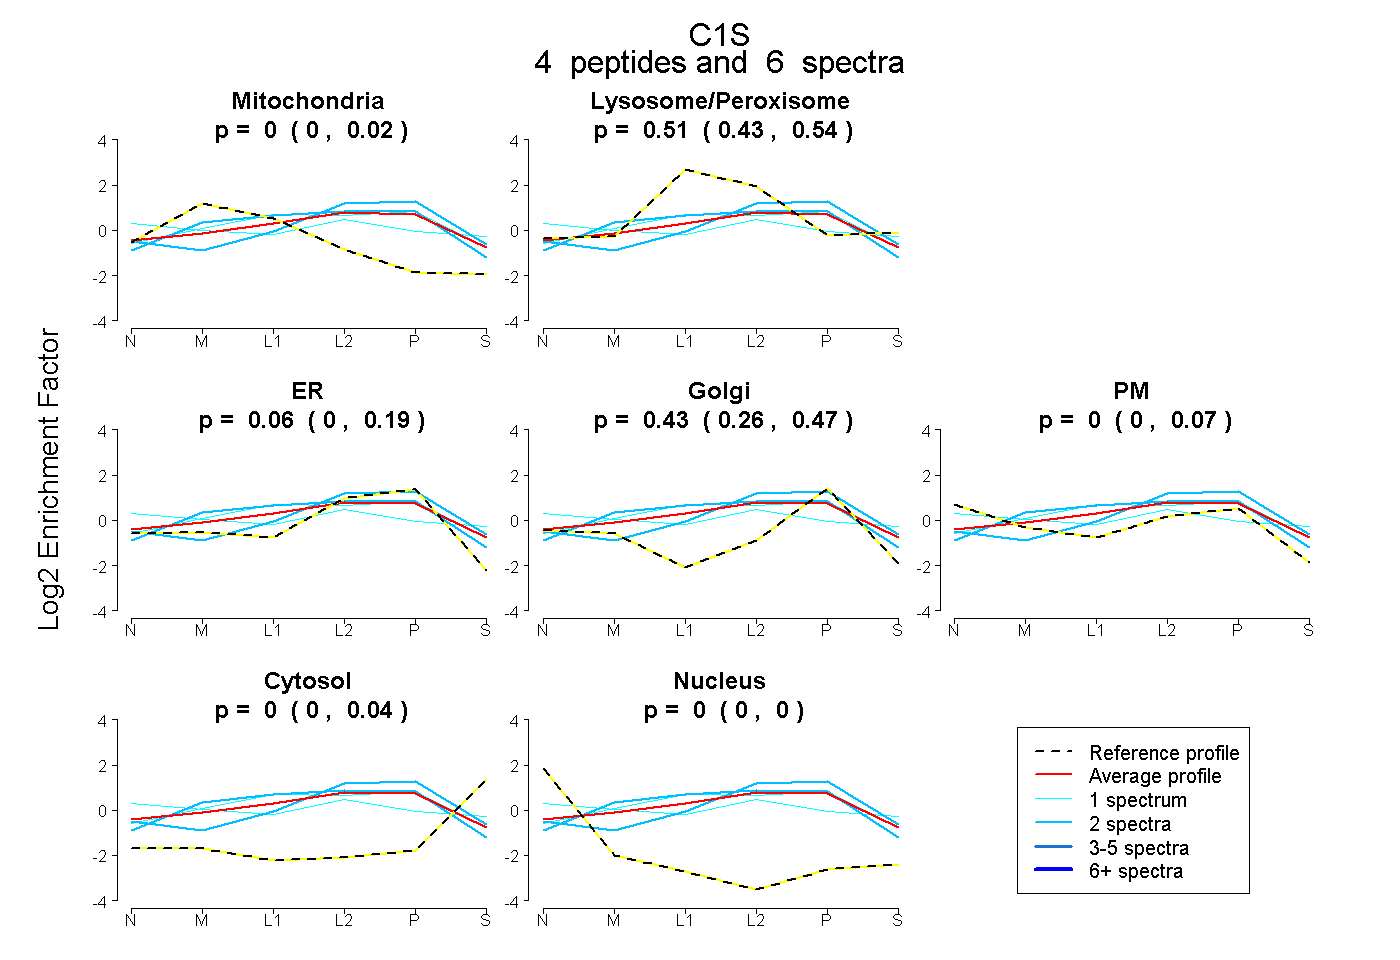
0.000 | 0.022
0.432 | 0.537
0.000 | 0.191
0.265 | 0.469
0.000 | 0.067
0.000 | 0.044
0.000 | 0.000
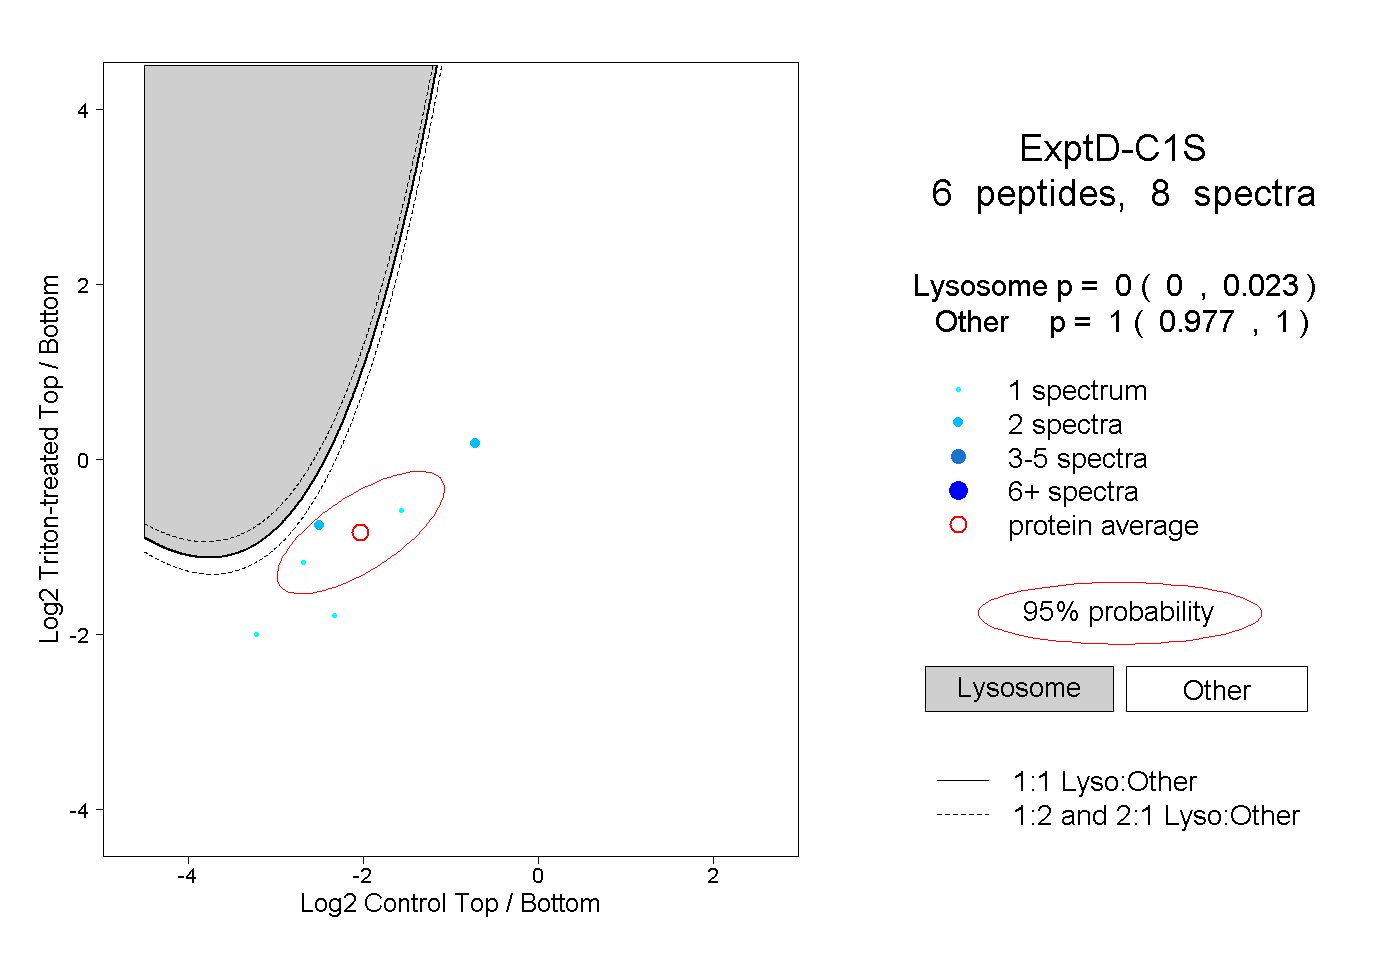
15peptides
spectra
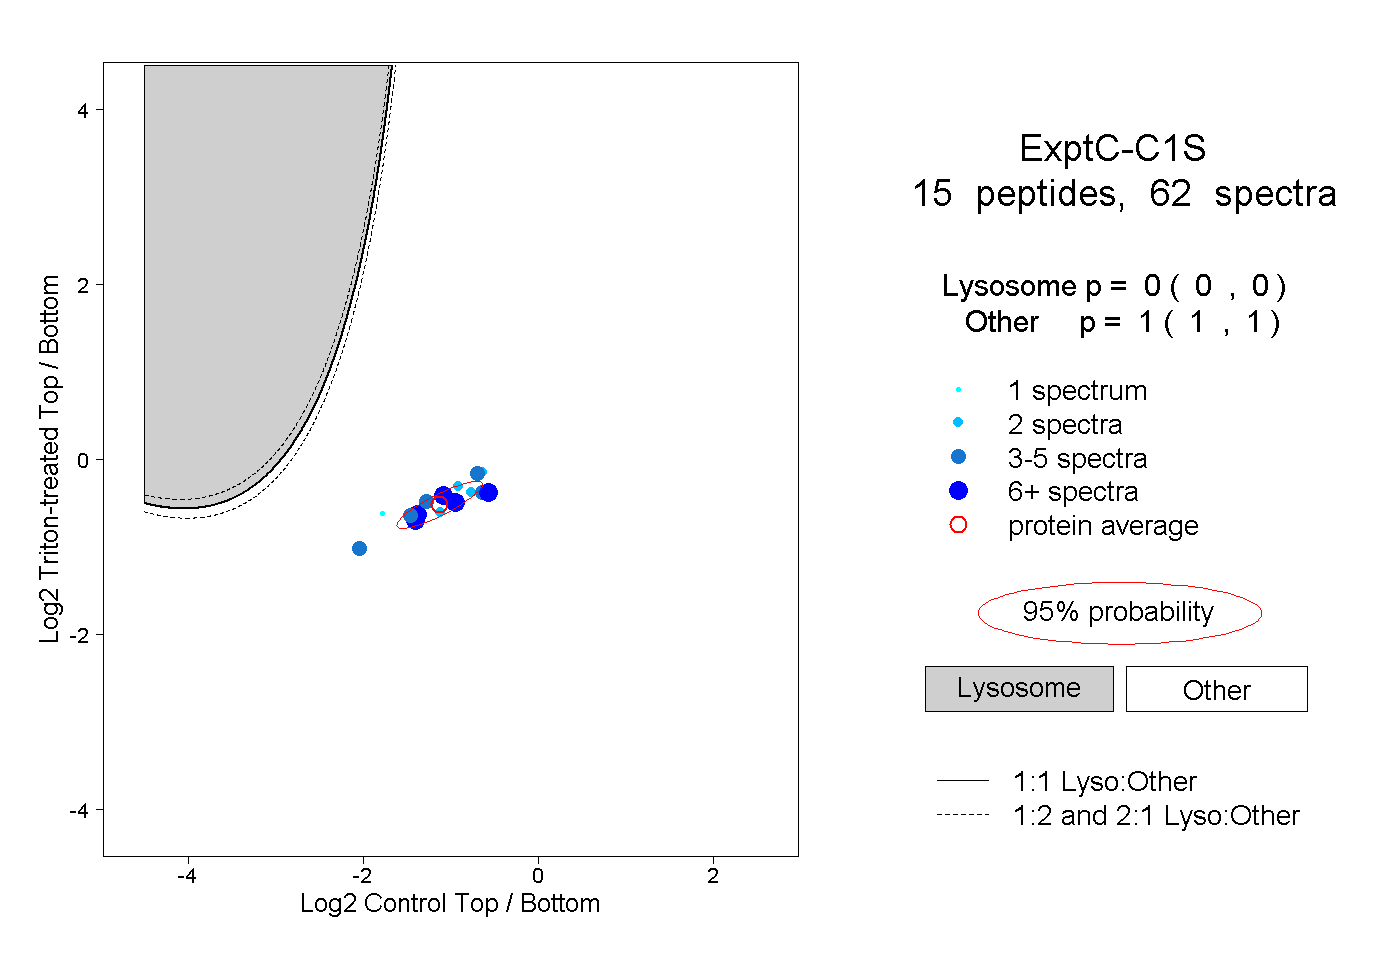
0.000 | 0.000
1.000 | 1.000