 9
9peptides
spectra
0.000 | 0.000
0.570 | 0.633
0.000 | 0.000
0.000 | 0.139
0.110 | 0.255
0.000 | 0.077
0.090 | 0.132
0.000 | 0.000
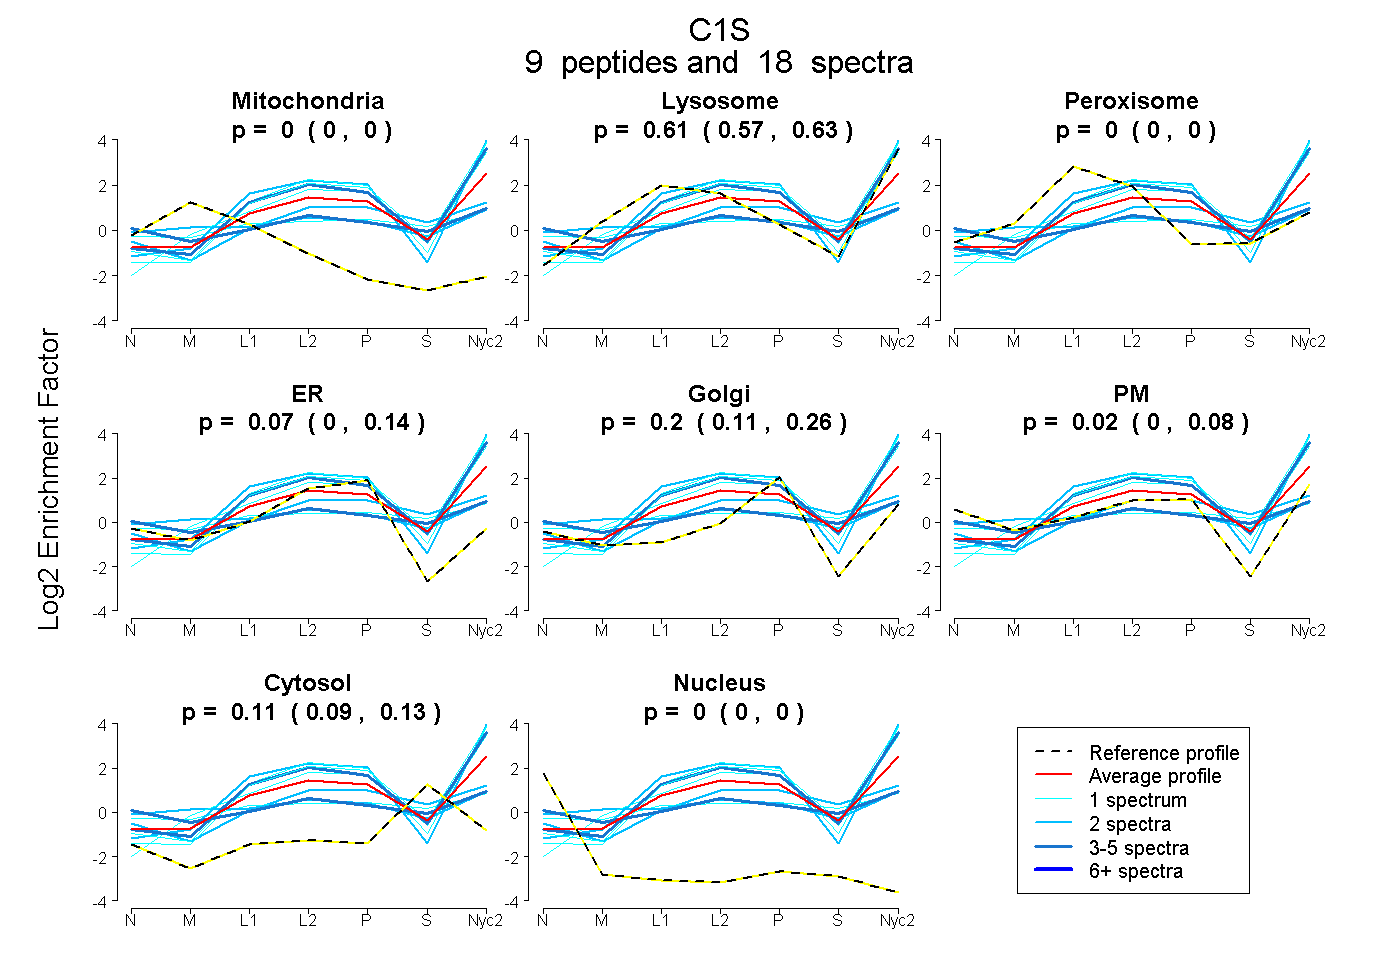
| Plot | Mito | Lyso | Perox | ER | Golgi | PM | Cytosol | Nucleus | |||||
| Expt A |
9 peptides |
18 spectra |
|
0.000 0.000 | 0.000 |
0.606 0.570 | 0.633 |
0.000 0.000 | 0.000 |
0.067 0.000 | 0.139 |
0.196 0.110 | 0.255 |
0.019 0.000 | 0.077 |
0.113 0.090 | 0.132 |
0.000 0.000 | 0.000 |
| 4 spectra, YHGDPIPCPK | 0.000 | 0.058 | 0.189 | 0.000 | 0.000 | 0.437 | 0.316 | 0.000 | ||
| 4 spectra, LVLTIR | 0.000 | 0.780 | 0.000 | 0.000 | 0.220 | 0.000 | 0.000 | 0.000 | ||
| 1 spectrum, IFGGYSTK | 0.000 | 0.773 | 0.000 | 0.011 | 0.217 | 0.000 | 0.000 | 0.000 | ||
| 1 spectrum, LPITSLEK | 0.000 | 0.801 | 0.000 | 0.000 | 0.199 | 0.000 | 0.000 | 0.000 | ||
| 2 spectra, CIPVCGVPTEPFK | 0.004 | 0.072 | 0.232 | 0.000 | 0.022 | 0.417 | 0.254 | 0.000 | ||
| 2 spectra, CEYQIR | 0.000 | 0.328 | 0.000 | 0.221 | 0.000 | 0.093 | 0.358 | 0.000 | ||
| 1 spectrum, TMQENSGPK | 0.000 | 0.806 | 0.000 | 0.000 | 0.194 | 0.000 | 0.000 | 0.000 | ||
| 2 spectra, EISANSIWEPEK | 0.000 | 0.827 | 0.000 | 0.044 | 0.129 | 0.000 | 0.000 | 0.000 | ||
| 1 spectrum, CGTYGIYTK | 0.000 | 0.118 | 0.261 | 0.000 | 0.122 | 0.189 | 0.310 | 0.000 |
| Plot | Mito | Lyso or Perox | ER | Golgi | PM | Cytosol | Nucleus | ||||||
| Expt B |
4 peptides |
6 spectra |
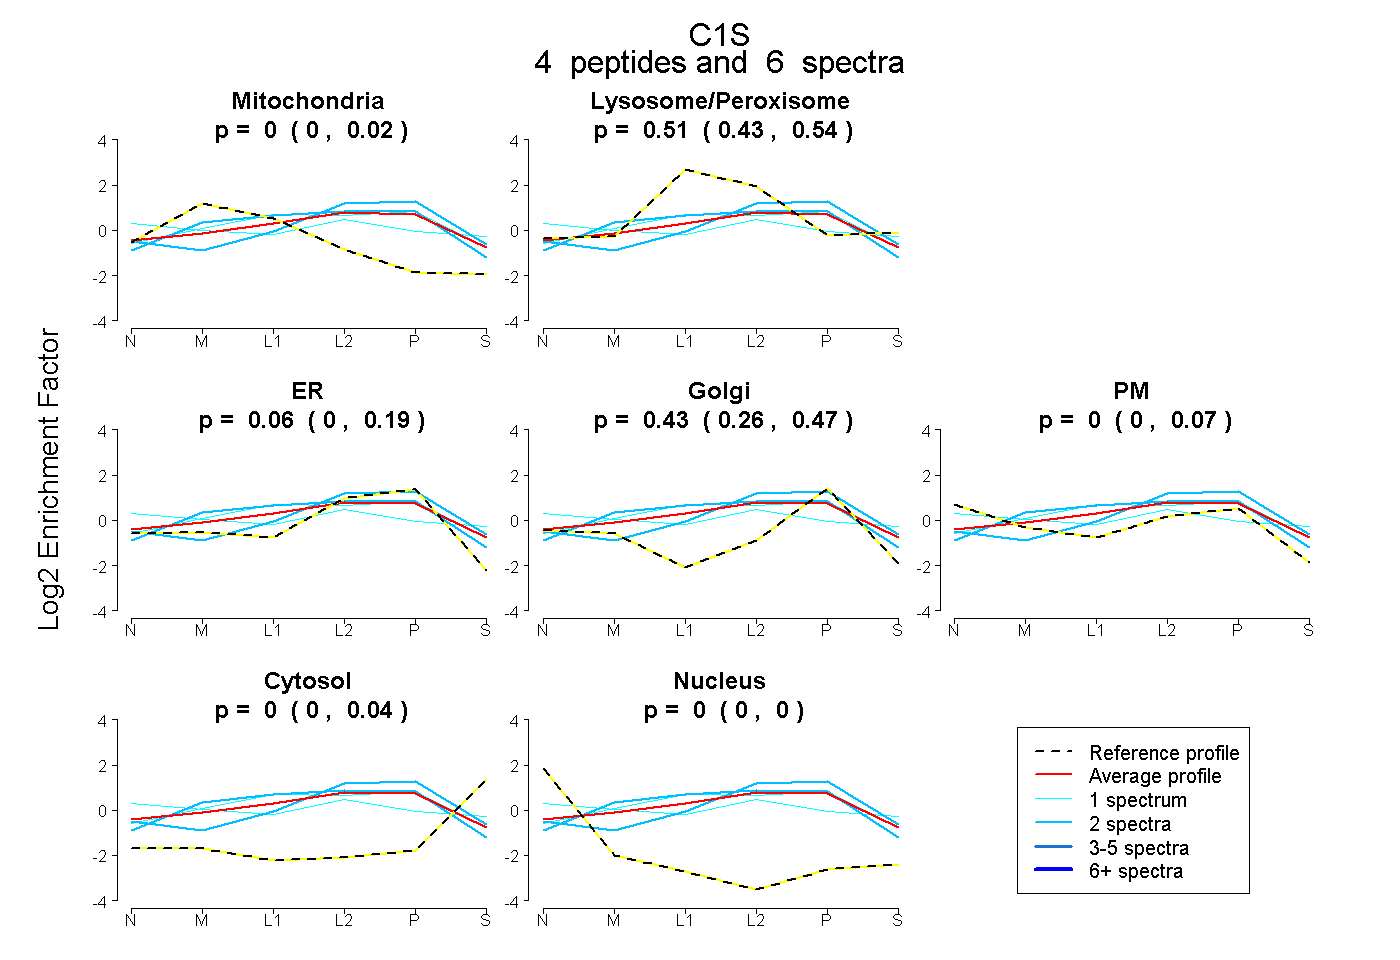 |
0.000 0.000 | 0.022 |
0.509 0.432 | 0.537 |
0.058 0.000 | 0.191 |
0.433 0.265 | 0.469 |
0.000 0.000 | 0.067 |
0.000 0.000 | 0.044 |
0.000 0.000 | 0.000 |
|||
| Plot | Lyso | Other | |||||||||||
| Expt C |
15 peptides |
62 spectra |
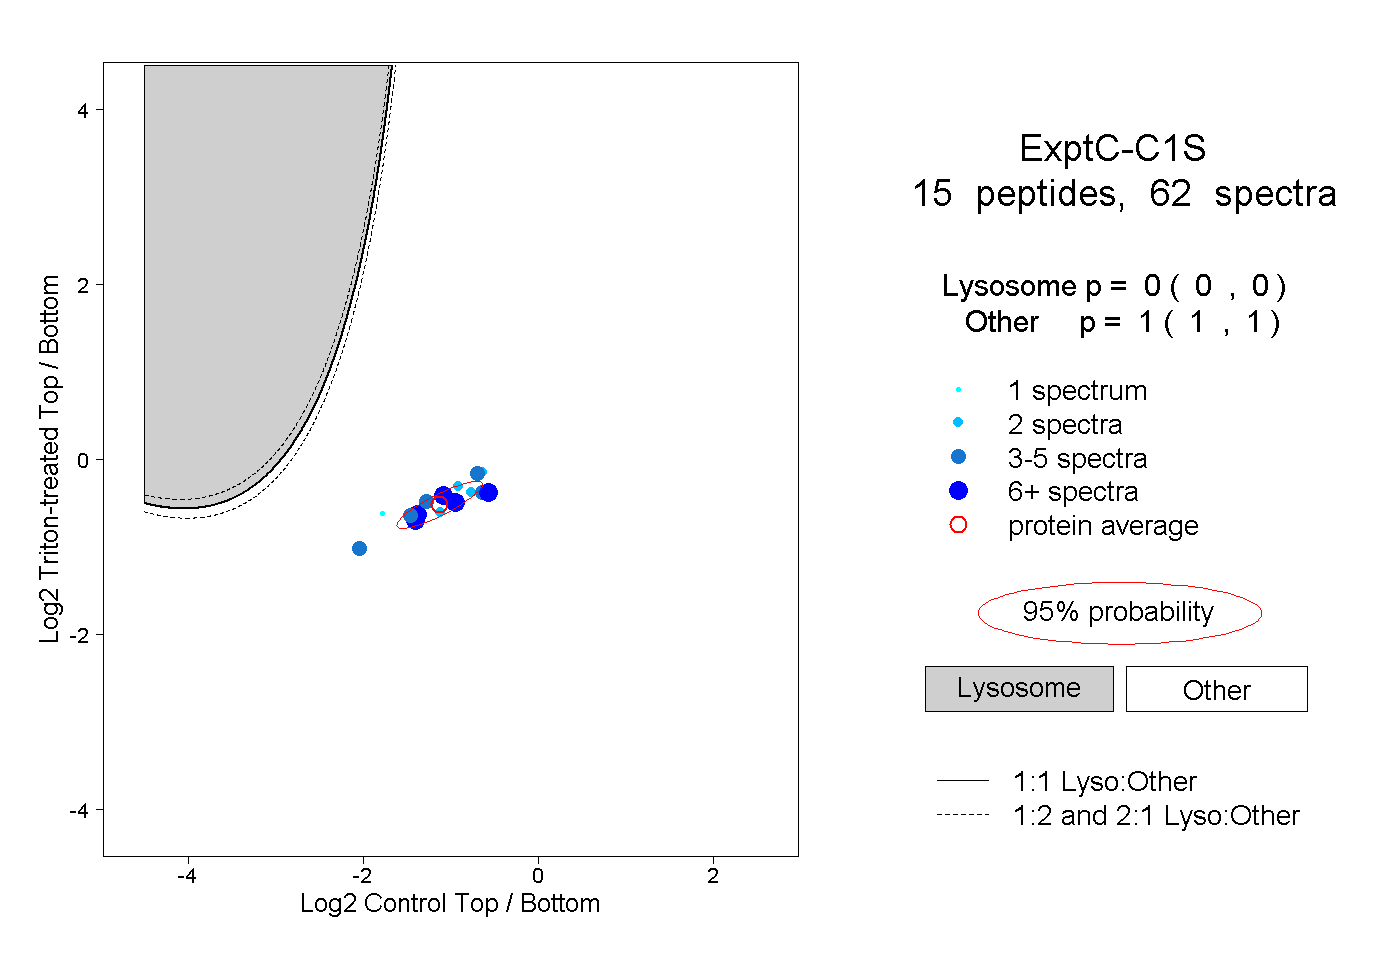 |
0.000 0.000 | 0.000 |
1.000 1.000 | 1.000 |
||||||||
| Plot | Lyso | Other | |||||||||||
| Expt D |
6 peptides |
8 spectra |
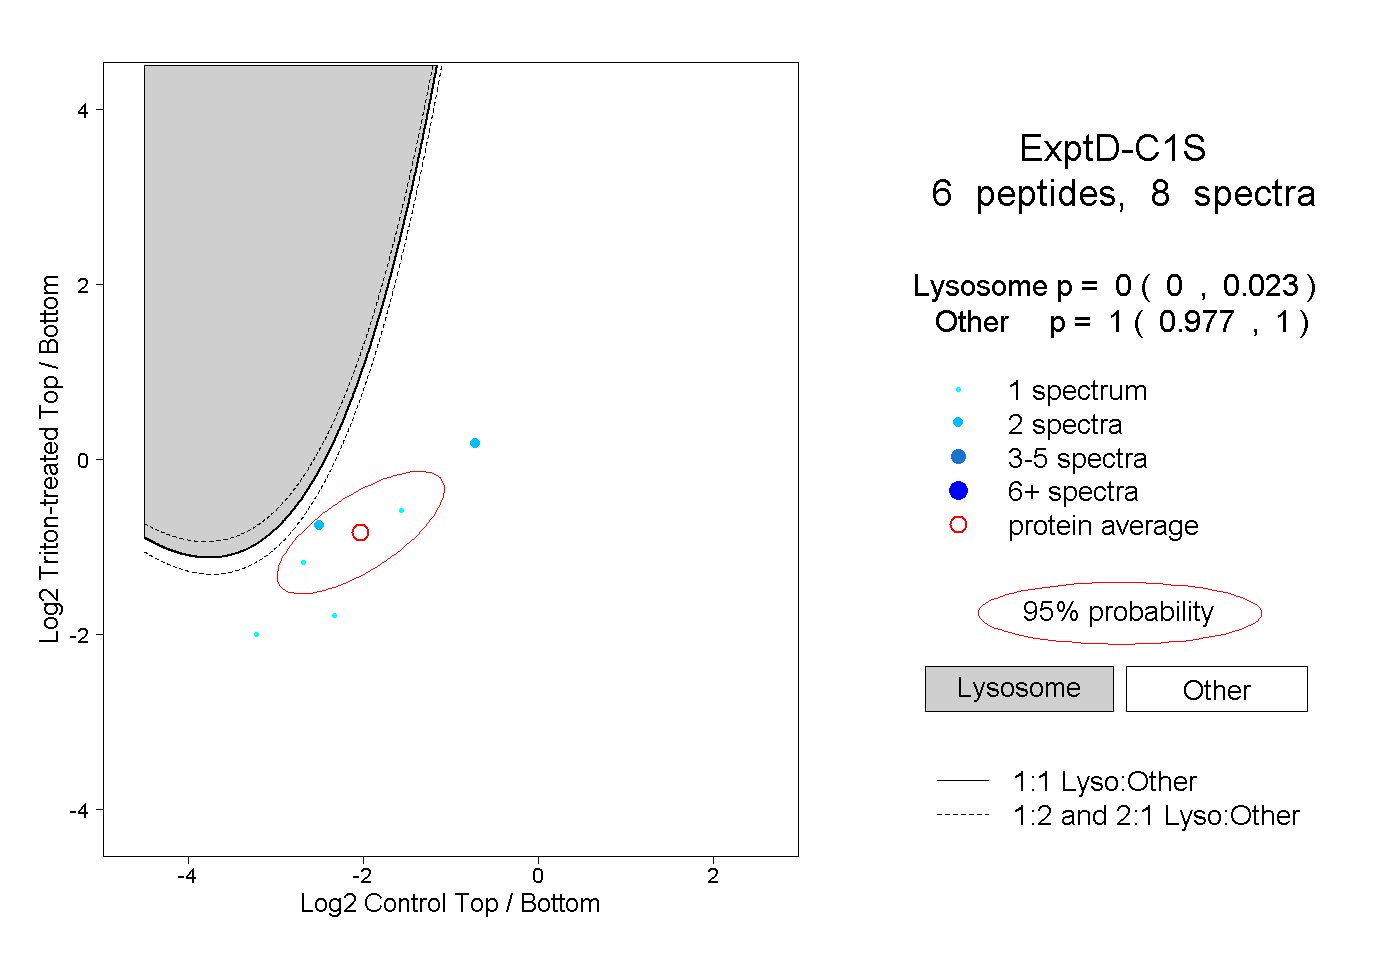 |
0.000 0.000 | 0.023 |
1.000 0.977 | 1.000 |