 5
5peptides
spectra
0.000 | 0.079
0.000 | 0.000
0.000 | 0.019
0.628 | 0.735
0.000 | 0.063
0.168 | 0.265
0.000 | 0.000
0.001 | 0.054
8peptides
spectra
0.000 | 0.000
1.000 | 1.000
| Plot | Mito | Lyso | Perox | ER | Golgi | PM | Cytosol | Nucleus | |||||
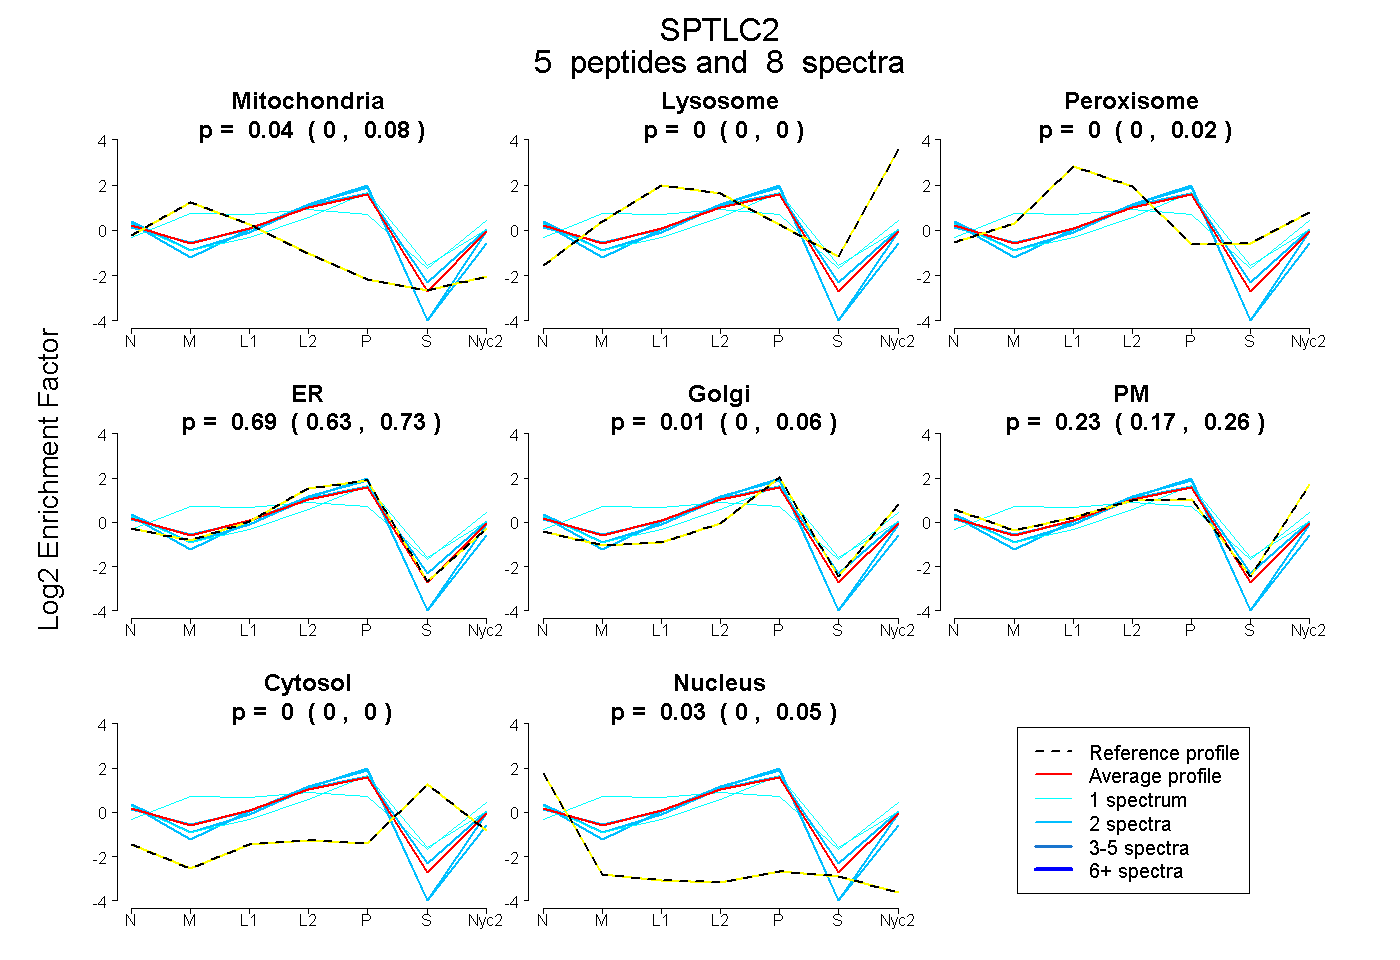
| Expt A |
5 peptides |
8 spectra |
|
0.038 0.000 | 0.079 |
0.000 0.000 | 0.000 |
0.000 0.000 | 0.019 |
0.693 0.628 | 0.735 |
0.006 0.000 | 0.063 |
0.231 0.168 | 0.265 |
0.000 0.000 | 0.000 |
0.032 0.001 | 0.054 |
||
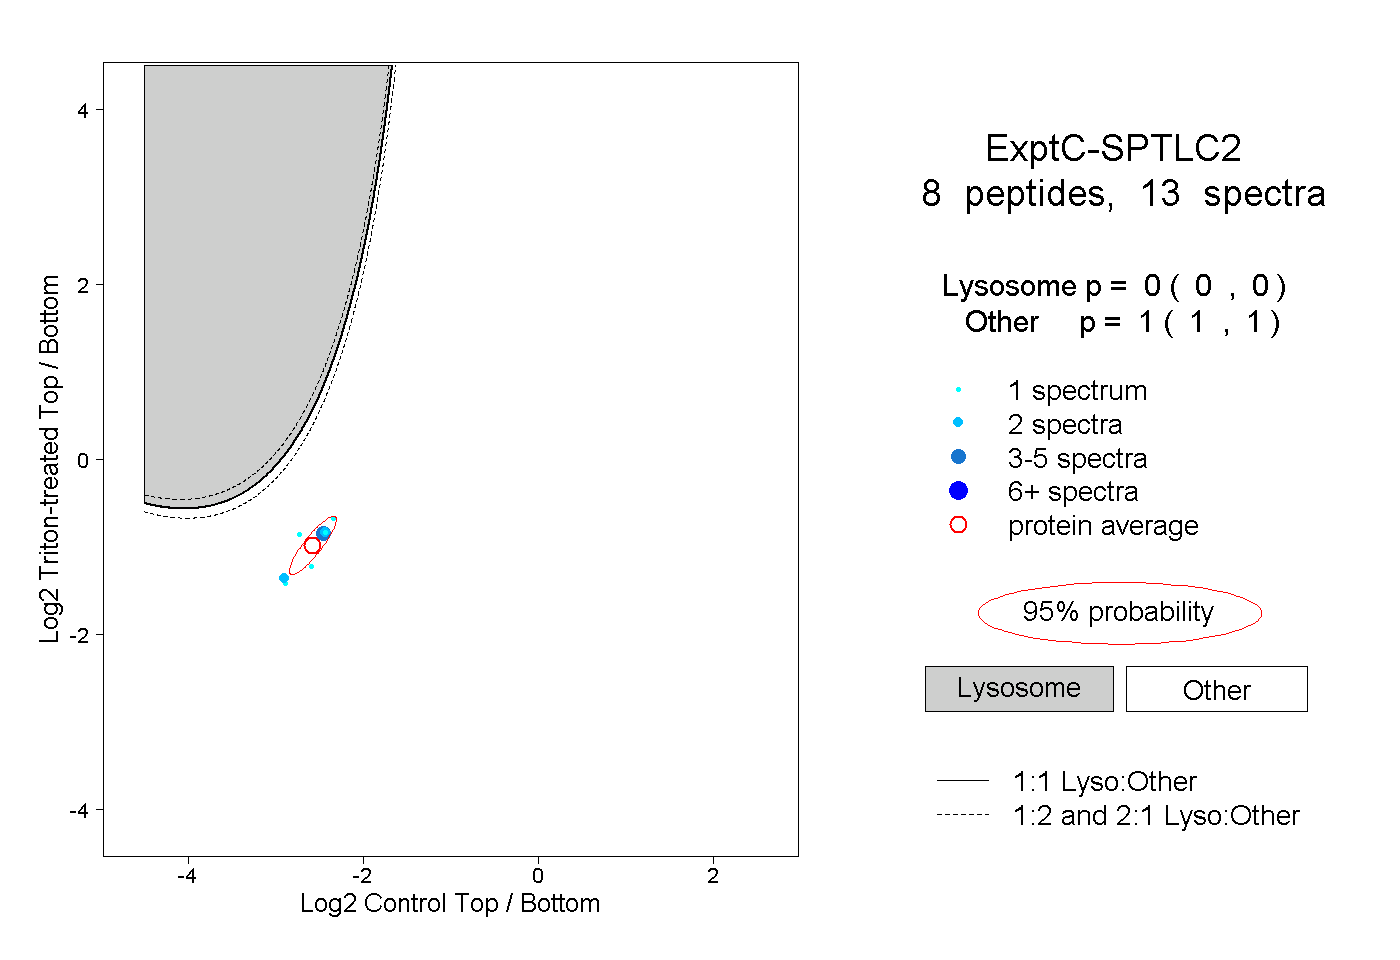
| Plot | Lyso | Other | |||||||||||
| Expt C |
8 peptides |
13 spectra |
|
0.000 0.000 | 0.000 |
1.000 1.000 | 1.000 |