 5
5peptides
spectra
0.000 | 0.000
0.000 | 0.000
0.000 | 0.097
0.266 | 0.527
0.000 | 0.059
0.000 | 0.109
0.000 | 0.158
0.351 | 0.487
| Plot | Mito | Lyso | Perox | ER | Golgi | PM | Cytosol | Nucleus | |||||
| Expt A |
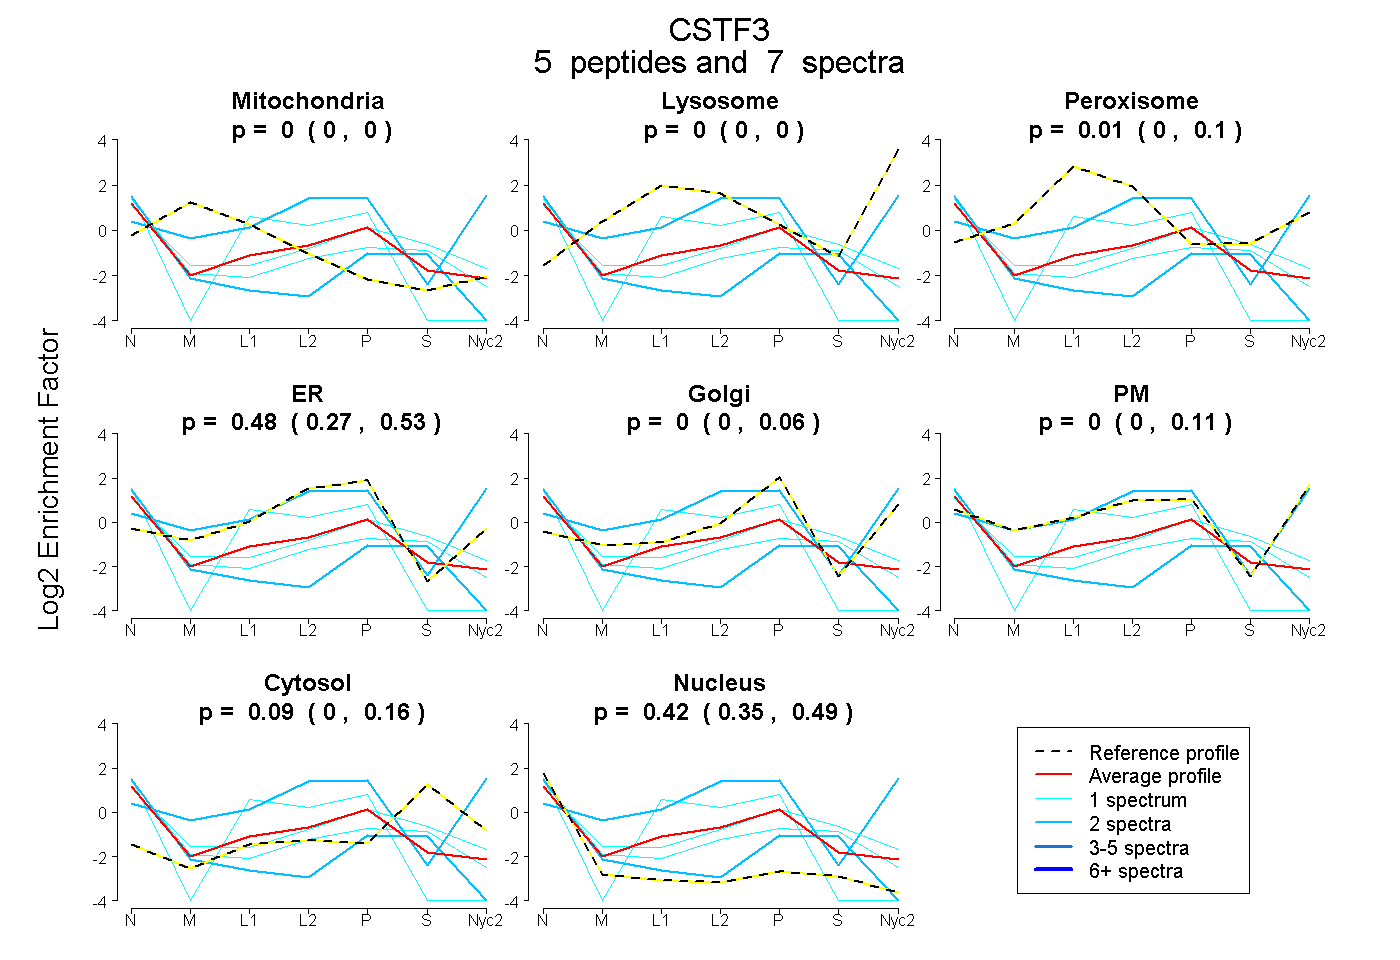
5 peptides |
7 spectra |
|
0.000 0.000 | 0.000 |
0.000 0.000 | 0.000 |
0.010 0.000 | 0.097 |
0.476 0.266 | 0.527 |
0.000 0.000 | 0.059 |
0.000 0.000 | 0.109 |
0.094 0.000 | 0.158 |
0.420 0.351 | 0.487 |
| 1 spectrum, FMDLYPCSASELK | 0.000 | 0.000 | 0.000 | 0.550 | 0.000 | 0.000 | 0.000 | 0.450 | ||
| 1 spectrum, YEEGINIHLAK | 0.000 | 0.000 | 0.000 | 0.336 | 0.000 | 0.054 | 0.305 | 0.305 | ||
| 2 spectra, LFSDEAANIYER | 0.000 | 0.000 | 0.000 | 0.040 | 0.000 | 0.000 | 0.215 | 0.746 | ||
| 1 spectrum, EEYEGK | 0.000 | 0.000 | 0.000 | 0.249 | 0.000 | 0.000 | 0.267 | 0.484 | ||
| 2 spectra, IFELGLK | 0.000 | 0.044 | 0.000 | 0.196 | 0.000 | 0.760 | 0.000 | 0.000 |
| Plot | Lyso | Other | |||||||||||
| Expt C |
2 peptides |
7 spectra |
 |
0.000 0.000 | 0.000 |
1.000 1.000 | 1.000 |