 9
9peptides
spectra
0.000 | 0.000
0.411 | 0.448
0.000 | 0.000
0.000 | 0.080
0.169 | 0.242
0.255 | 0.311
0.022 | 0.047
0.000 | 0.000
2peptides
spectra
NA | NA
NA | NA
NA | NA
NA | NA
NA | NA
NA | NA
NA | NA
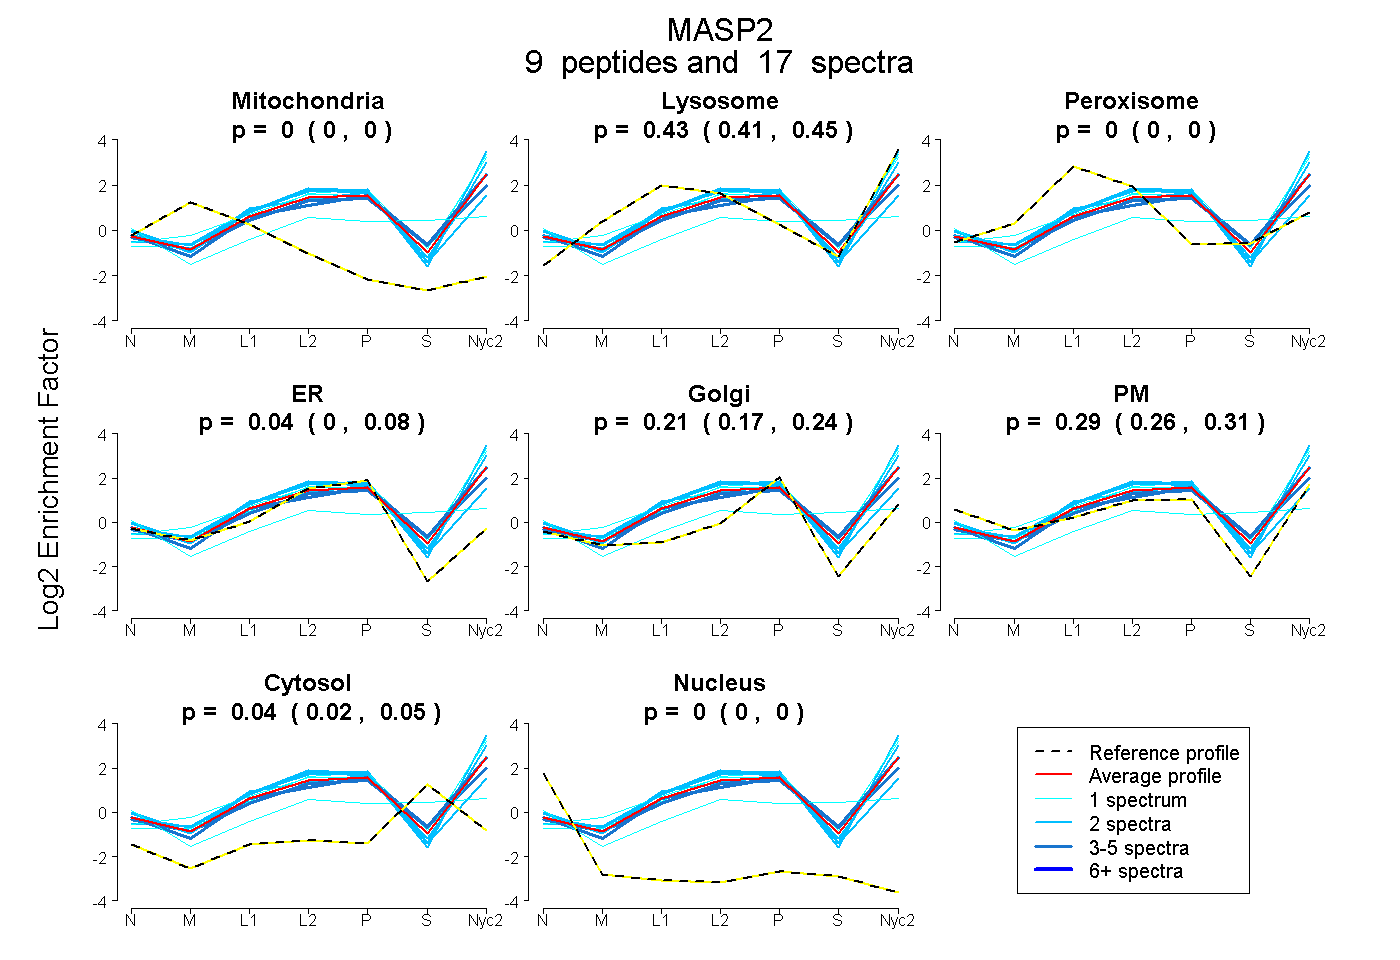
| Plot | Mito | Lyso | Perox | ER | Golgi | PM | Cytosol | Nucleus | |||||
| Expt A |
9 peptides |
17 spectra |
|
0.000 0.000 | 0.000 |
0.432 0.411 | 0.448 |
0.000 0.000 | 0.000 |
0.036 0.000 | 0.080 |
0.211 0.169 | 0.242 |
0.285 0.255 | 0.311 |
0.036 0.022 | 0.047 |
0.000 0.000 | 0.000 |
||
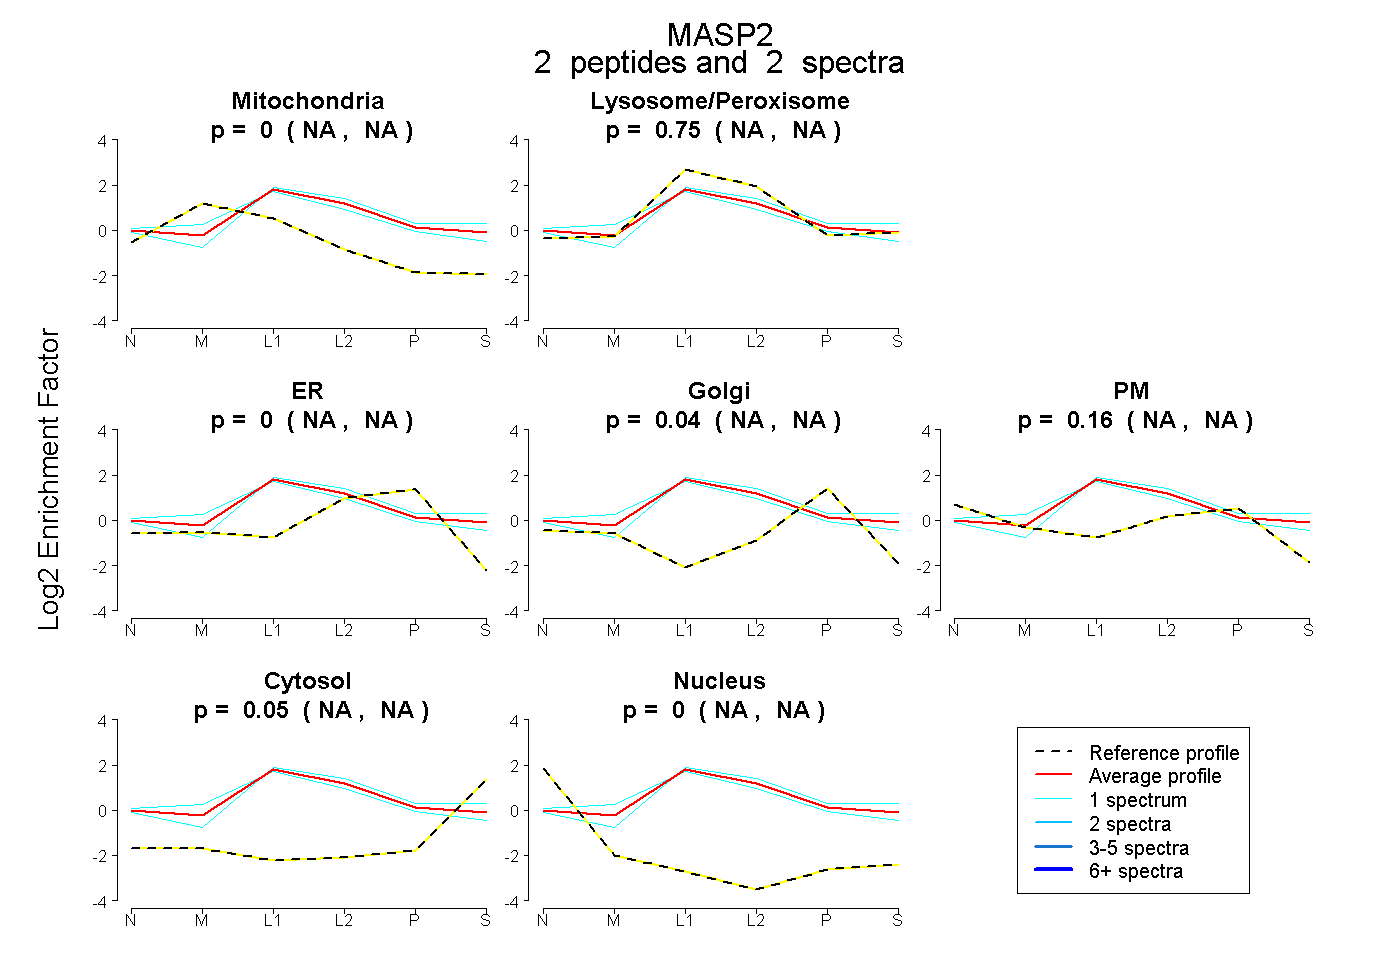
| Plot | Mito | Lyso or Perox | ER | Golgi | PM | Cytosol | Nucleus | ||||||
| Expt B |
2 peptides |
2 spectra |
|
0.000 NA | NA |
0.755 NA | NA |
0.000 NA | NA |
0.037 NA | NA |
0.160 NA | NA |
0.048 NA | NA |
0.000 NA | NA |
| 1 spectrum, LVSPGFPEK | 0.140 | 0.640 | 0.000 | 0.000 | 0.220 | 0.000 | 0.000 | |||
| 1 spectrum, SFTAVCQK | 0.000 | 0.833 | 0.000 | 0.097 | 0.000 | 0.070 | 0.000 |
| Plot | Lyso | Other | |||||||||||
| Expt C |
13 peptides |
29 spectra |
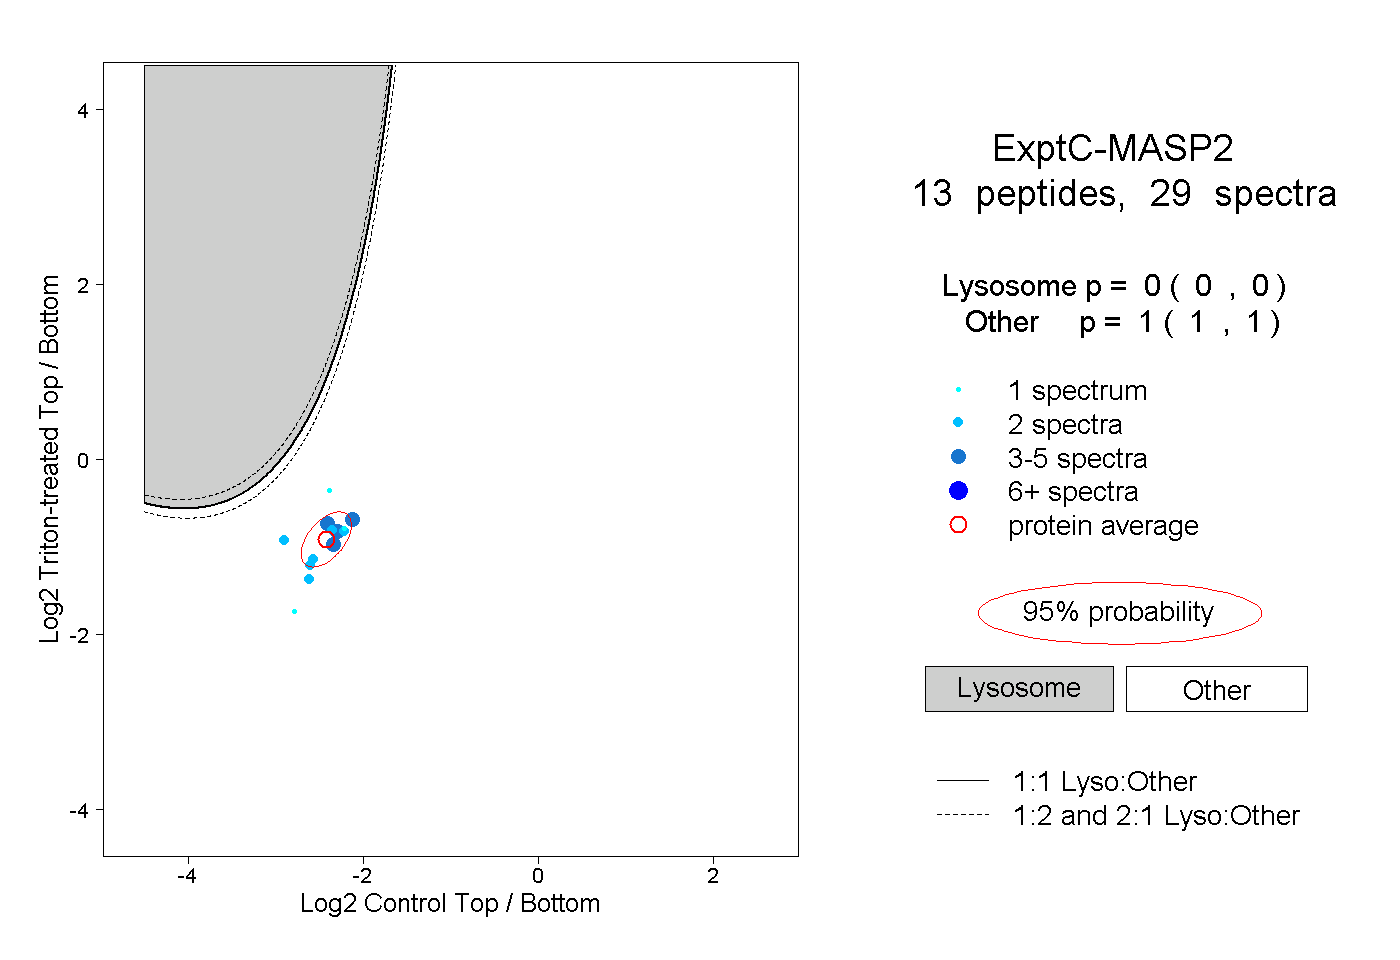 |
0.000 0.000 | 0.000 |
1.000 1.000 | 1.000 |
||||||||
| Plot | Lyso | Other | |||||||||||
| Expt D |
2 peptides |
4 spectra |
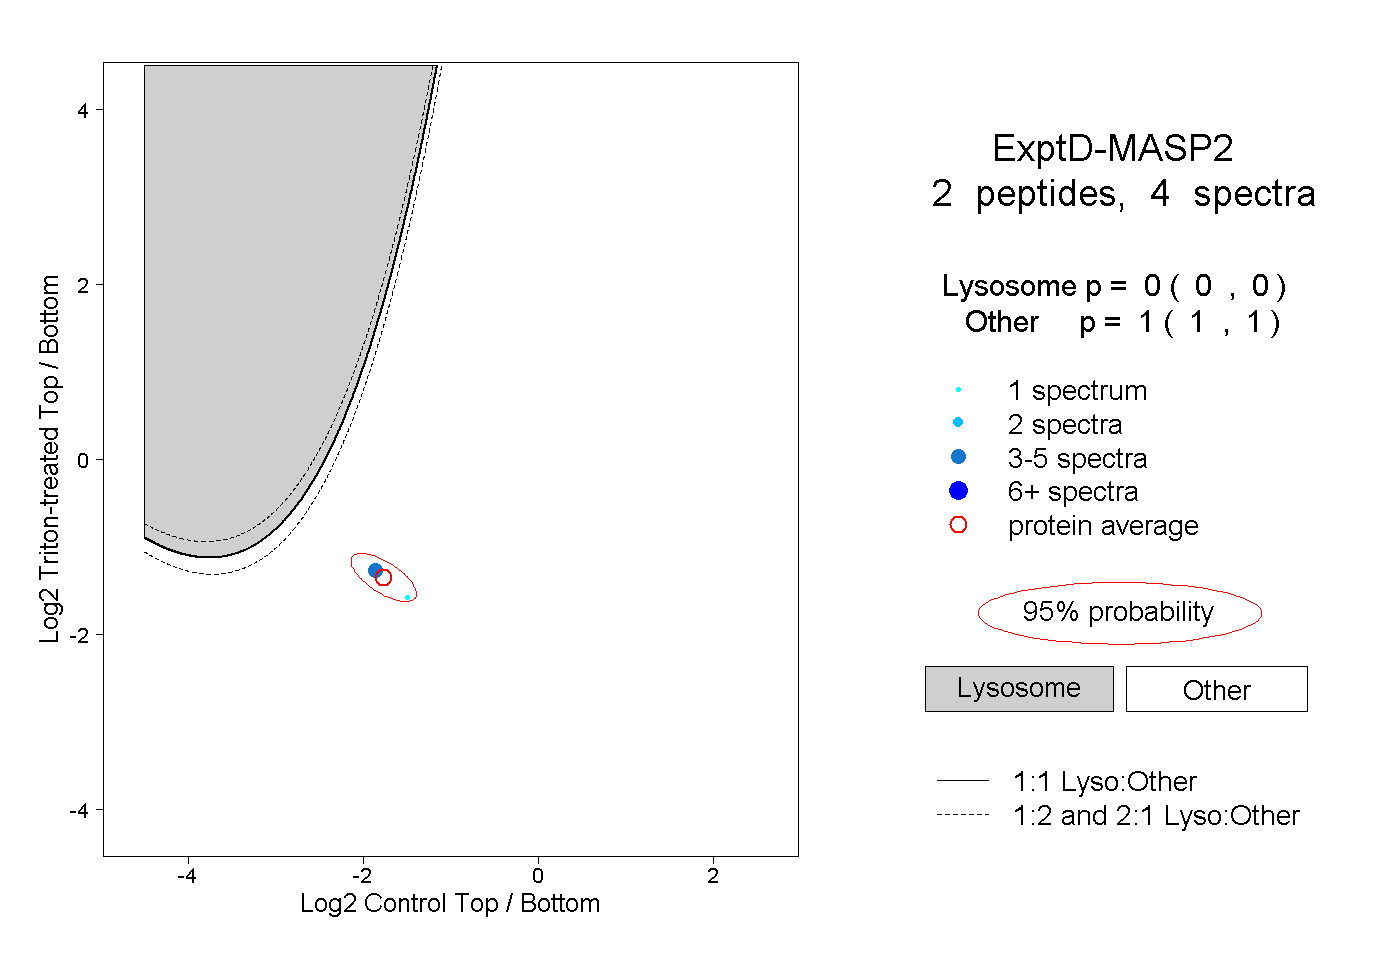 |
0.000 0.000 | 0.000 |
1.000 1.000 | 1.000 |