 5
5peptides
spectra
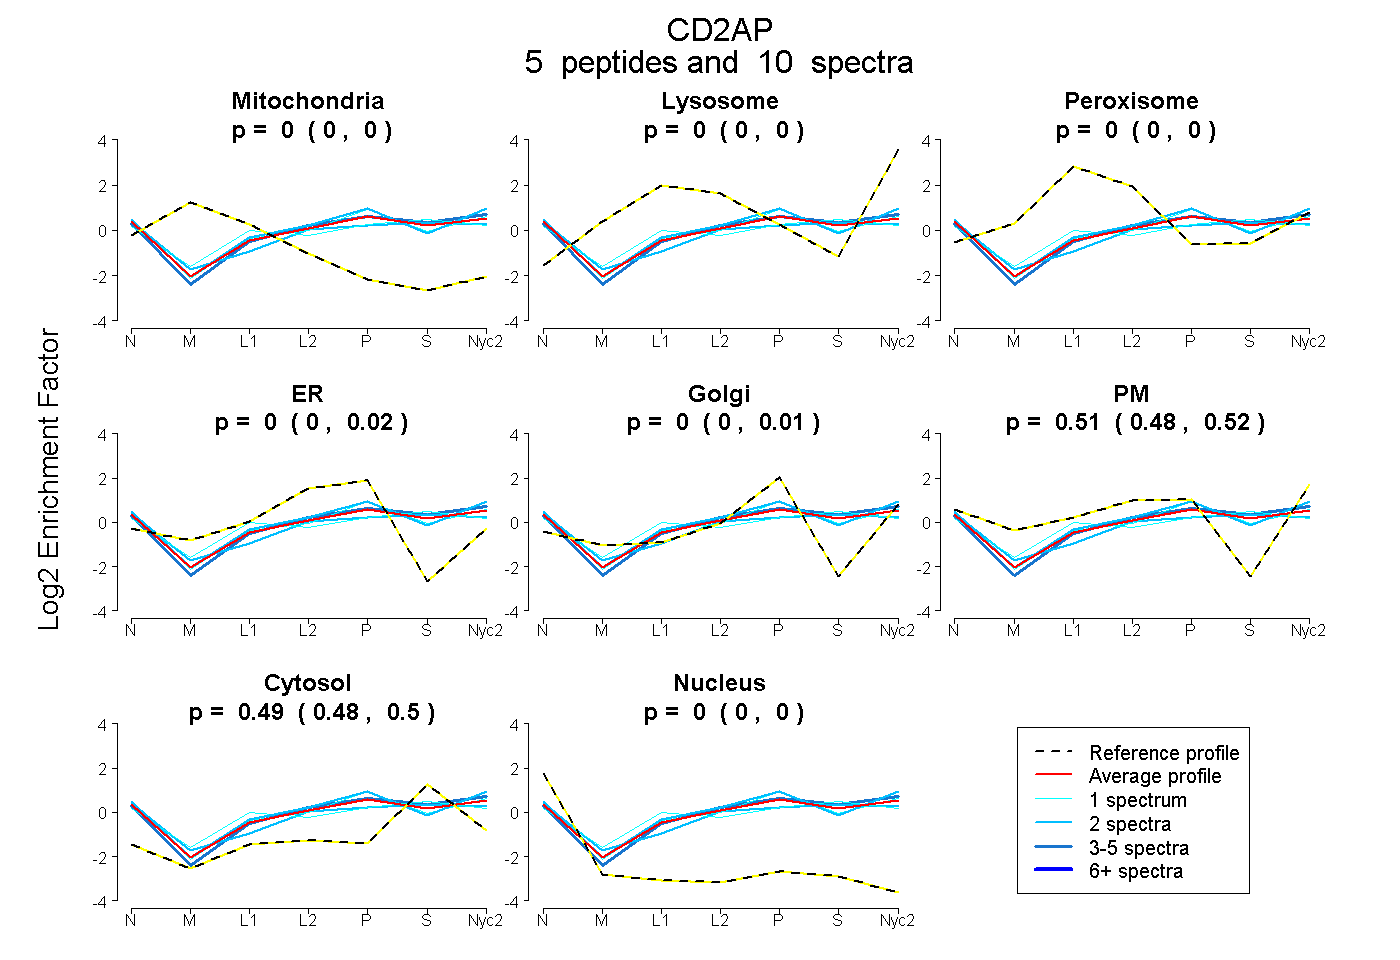
0.000 | 0.000
0.000 | 0.000
0.000 | 0.000
0.000 | 0.022
0.000 | 0.006
0.478 | 0.518
0.477 | 0.501
0.000 | 0.000
4peptides
spectra
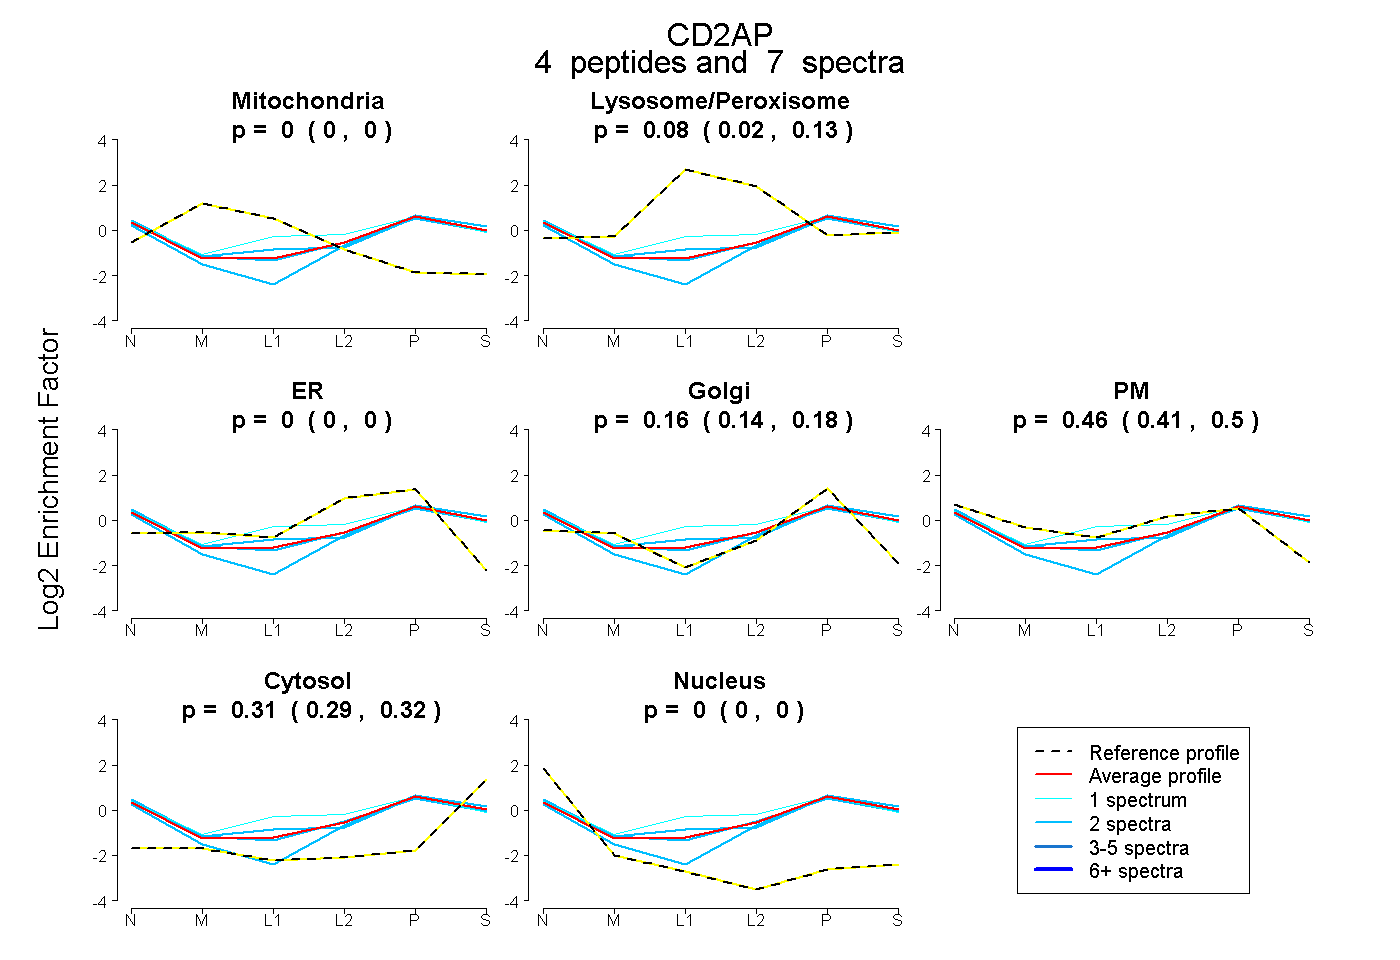
0.000 | 0.000
0.022 | 0.125
0.000 | 0.000
0.140 | 0.177
0.408 | 0.496
0.287 | 0.321
0.000 | 0.000
11peptides
spectra
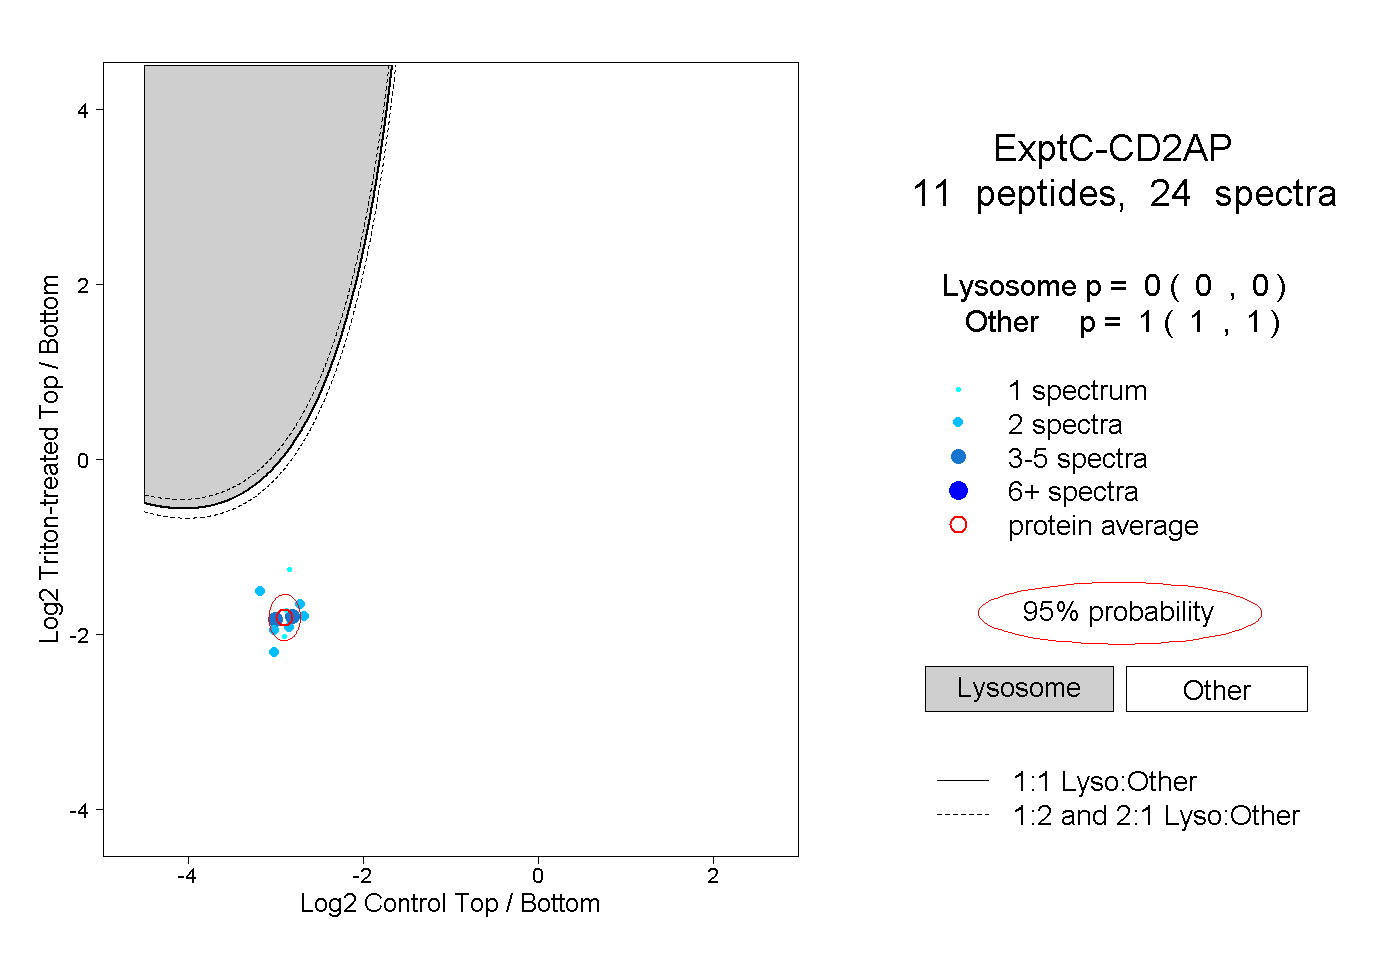
0.000 | 0.000
1.000 | 1.000
1peptide
spectrum
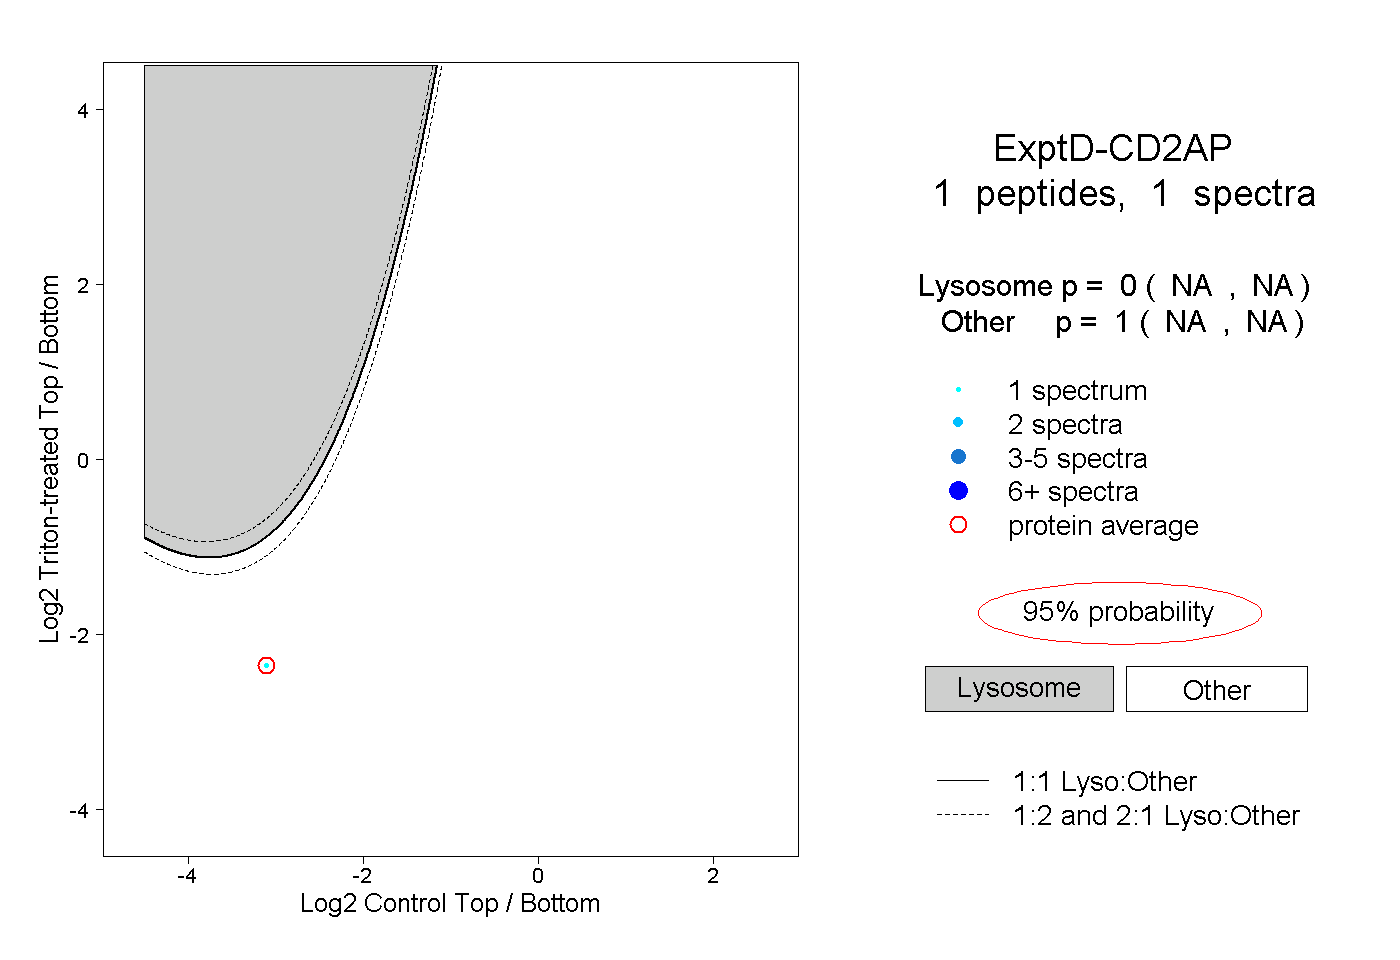
NA | NA
NA | NA