 10
10peptides
spectra
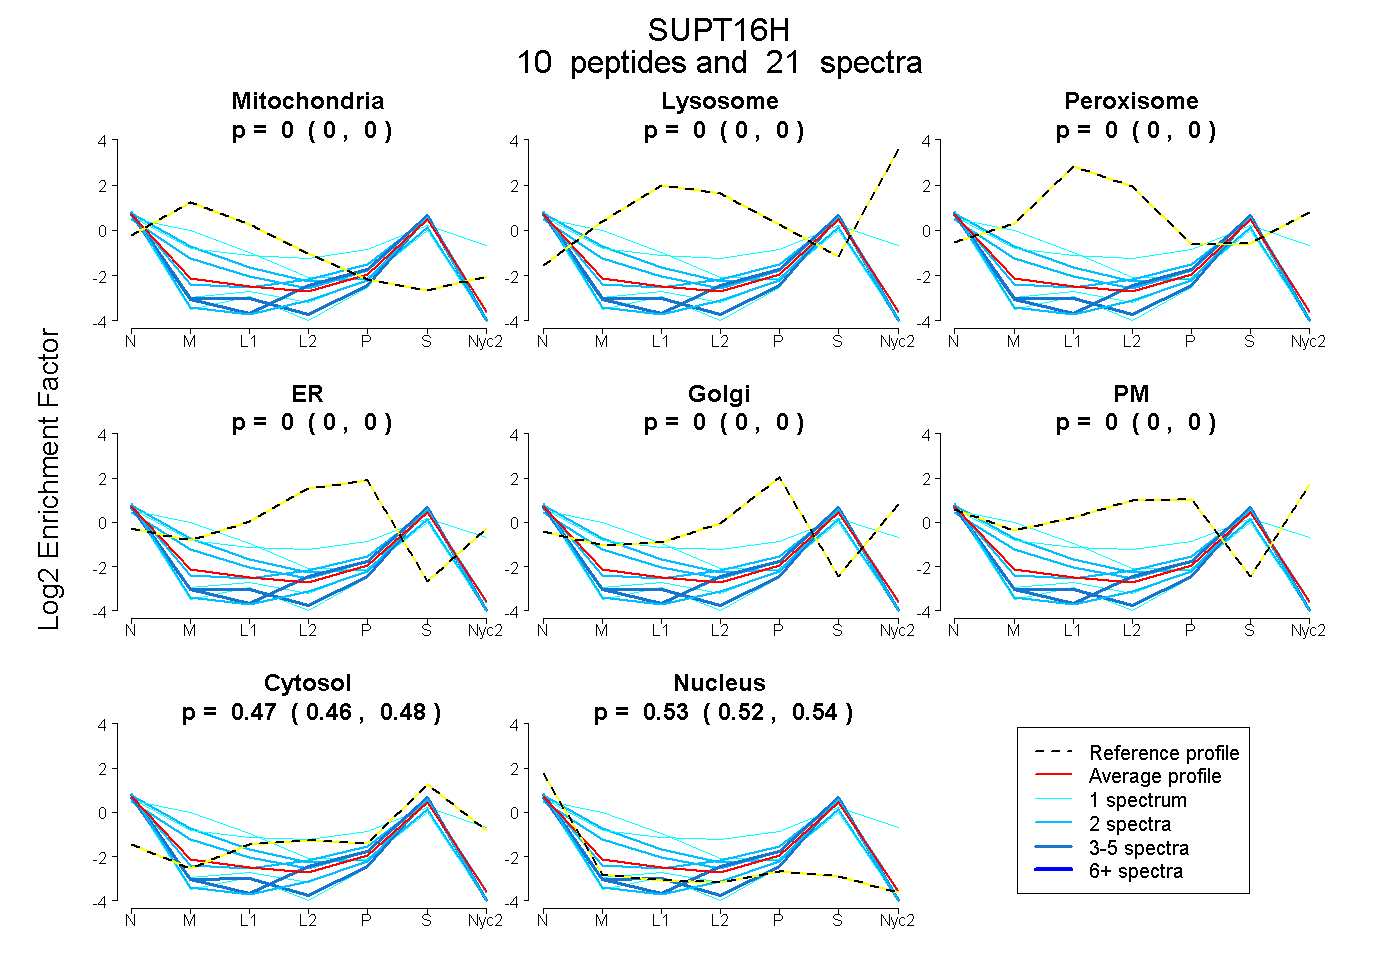
0.000 | 0.000
0.000 | 0.000
0.000 | 0.000
0.000 | 0.000
0.000 | 0.000
0.000 | 0.000
0.459 | 0.481
0.518 | 0.539
| Plot | Mito | Lyso | Perox | ER | Golgi | PM | Cytosol | Nucleus | |||||
| Expt A |
10 peptides |
21 spectra |
|
0.000 0.000 | 0.000 |
0.000 0.000 | 0.000 |
0.000 0.000 | 0.000 |
0.000 0.000 | 0.000 |
0.000 0.000 | 0.000 |
0.000 0.000 | 0.000 |
0.471 0.459 | 0.481 |
0.529 0.518 | 0.539 |
| 2 spectra, SYCSNLVR | 0.103 | 0.000 | 0.000 | 0.000 | 0.000 | 0.000 | 0.476 | 0.421 | ||
| 2 spectra, SNVSYK | 0.000 | 0.000 | 0.000 | 0.000 | 0.000 | 0.000 | 0.505 | 0.495 | ||
| 1 spectrum, EELEFEVPFR | 0.000 | 0.000 | 0.000 | 0.000 | 0.000 | 0.000 | 0.369 | 0.631 | ||
| 2 spectra, VQFHLK | 0.000 | 0.000 | 0.000 | 0.000 | 0.000 | 0.000 | 0.363 | 0.637 | ||
| 1 spectrum, IGVFSK | 0.448 | 0.000 | 0.000 | 0.000 | 0.000 | 0.000 | 0.267 | 0.285 | ||
| 2 spectra, ELAAQLNEEAK | 0.259 | 0.000 | 0.000 | 0.000 | 0.000 | 0.000 | 0.327 | 0.415 | ||
| 1 spectrum, AASITSEVFNK | 0.000 | 0.000 | 0.000 | 0.000 | 0.000 | 0.000 | 0.412 | 0.588 | ||
| 4 spectra, INFYCPGSALGR | 0.000 | 0.000 | 0.000 | 0.000 | 0.000 | 0.000 | 0.368 | 0.632 | ||
| 5 spectra, VMEIVDADEK | 0.000 | 0.000 | 0.000 | 0.000 | 0.000 | 0.000 | 0.432 | 0.568 | ||
| 1 spectrum, NVGIFLK | 0.143 | 0.000 | 0.000 | 0.000 | 0.000 | 0.241 | 0.503 | 0.113 |
| Plot | Mito | Lyso or Perox | ER | Golgi | PM | Cytosol | Nucleus | ||||||
| Expt B |
1 peptide |
2 spectra |
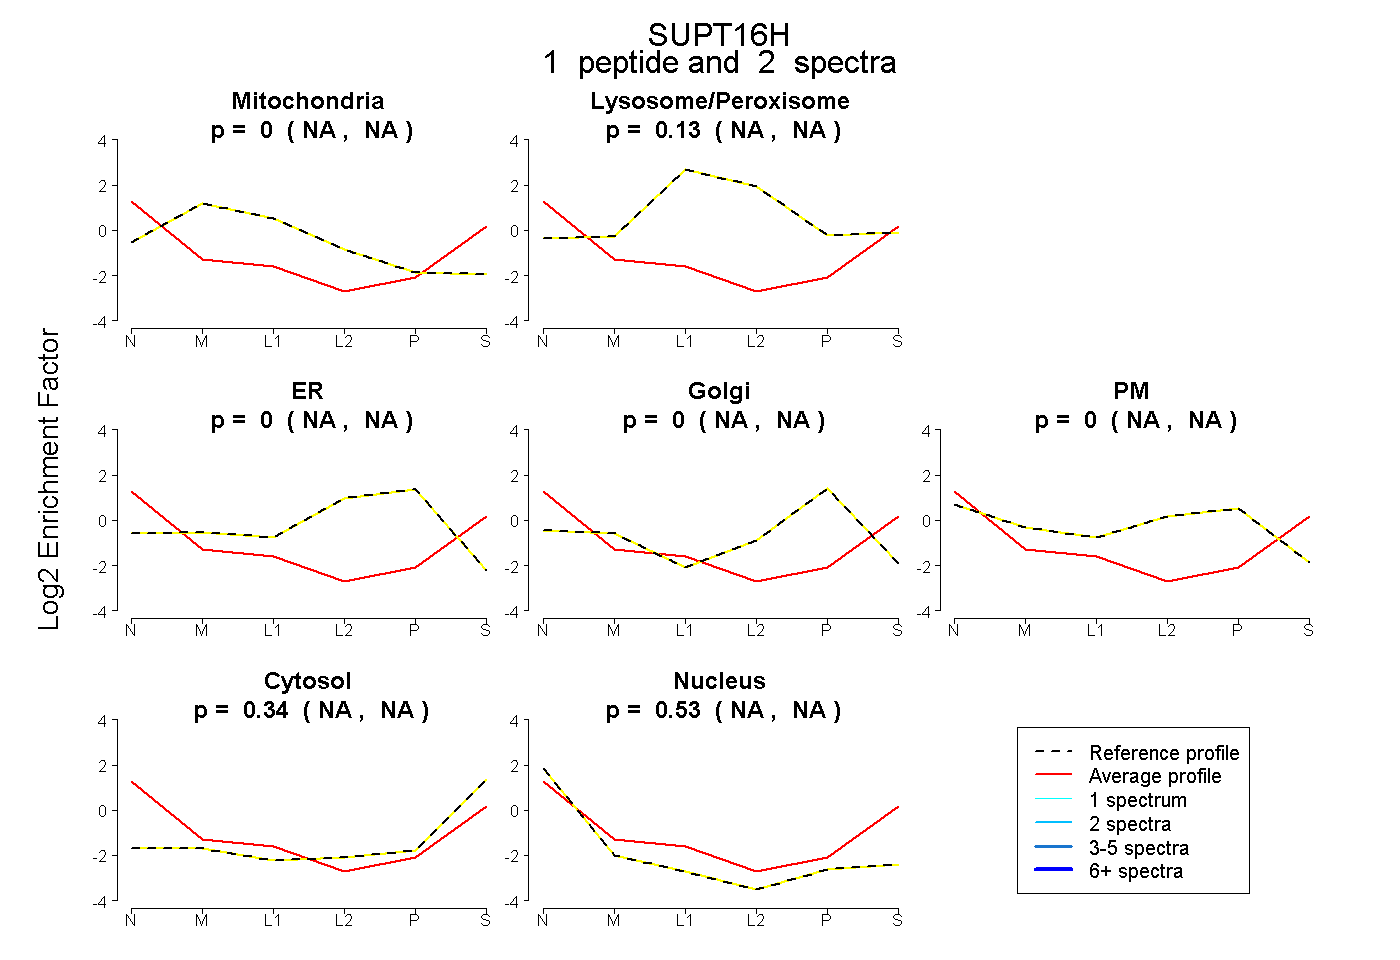 |
0.000 NA | NA |
0.126 NA | NA |
0.000 NA | NA |
0.000 NA | NA |
0.000 NA | NA |
0.343 NA | NA |
0.531 NA | NA |
|||
| Plot | Lyso | Other | |||||||||||
| Expt C |
1 peptide |
1 spectrum |
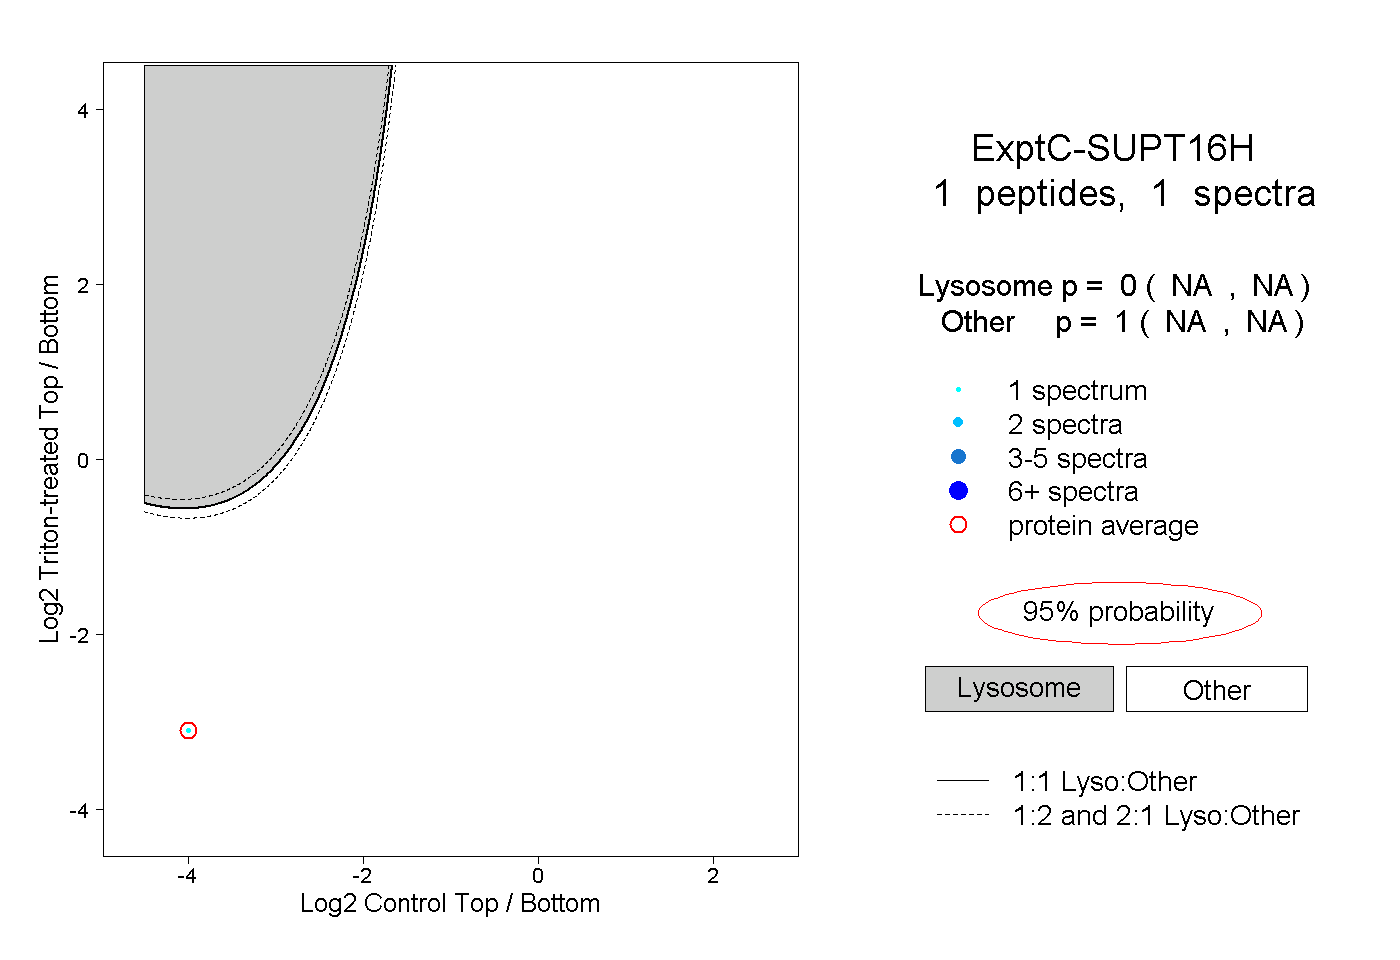 |
0.000 NA | NA |
1.000 NA | NA |