 2
2peptides
spectra
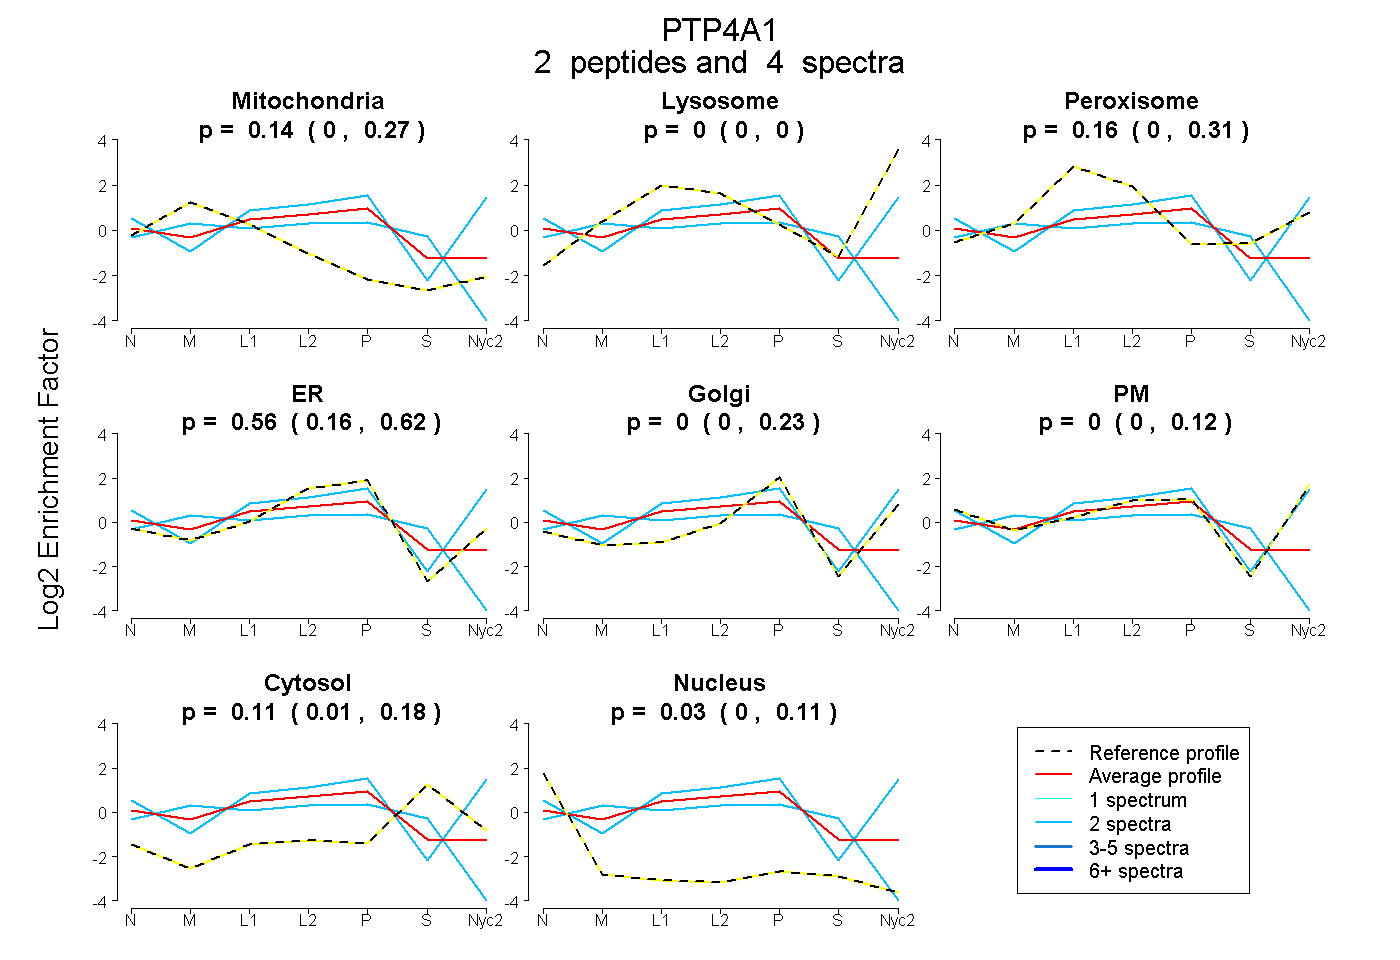
0.000 | 0.271
0.000 | 0.000
0.005 | 0.312
0.165 | 0.622
0.000 | 0.225
0.000 | 0.124
0.006 | 0.182
0.000 | 0.107
1peptide
spectrum
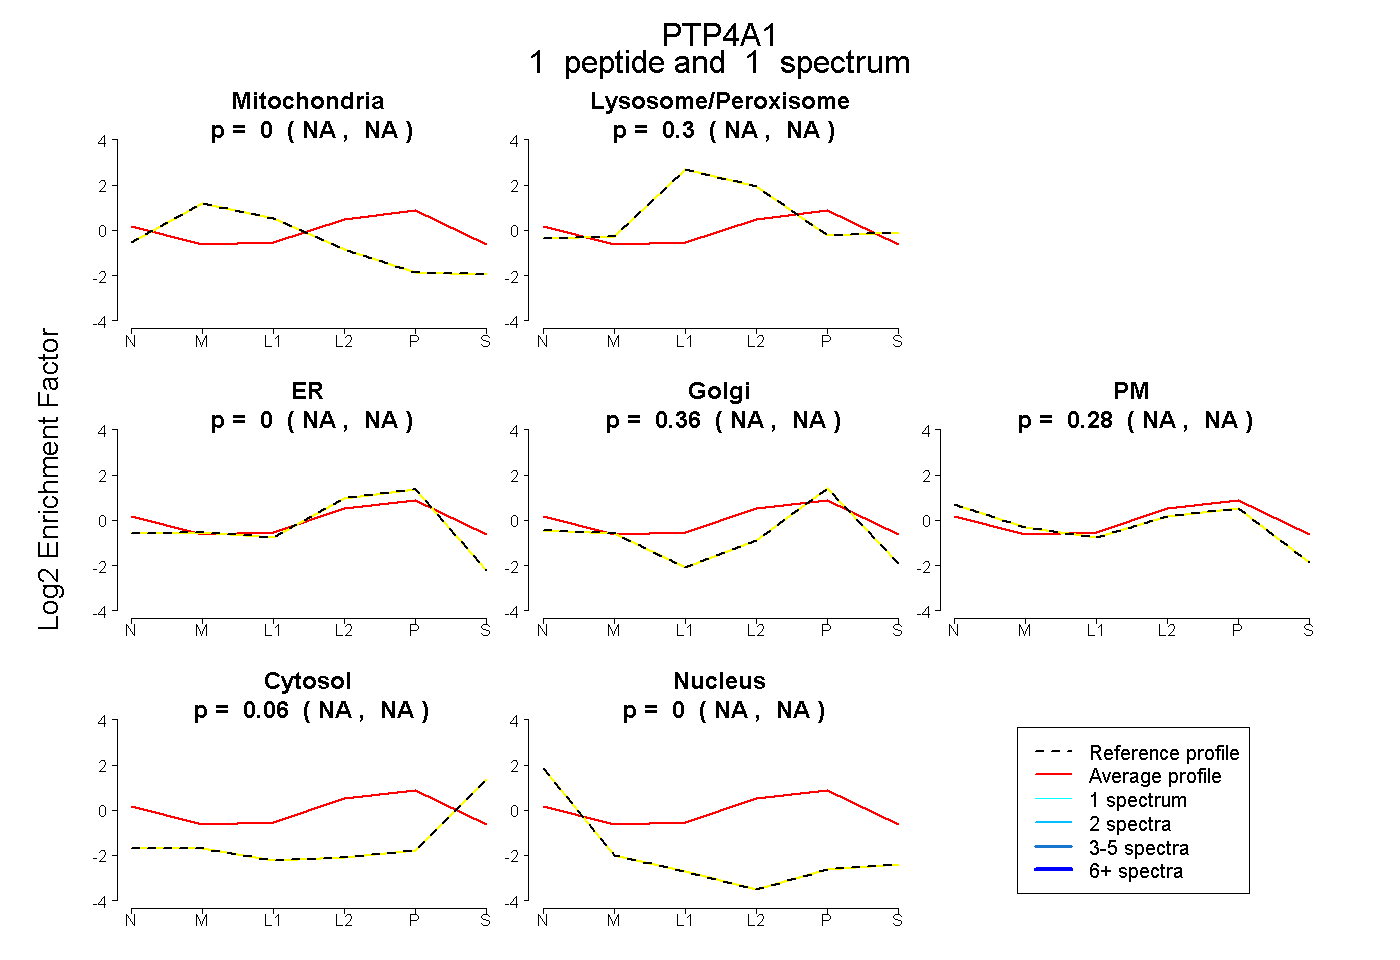
NA | NA
NA | NA
NA | NA
NA | NA
NA | NA
NA | NA
NA | NA
1peptide
spectrum
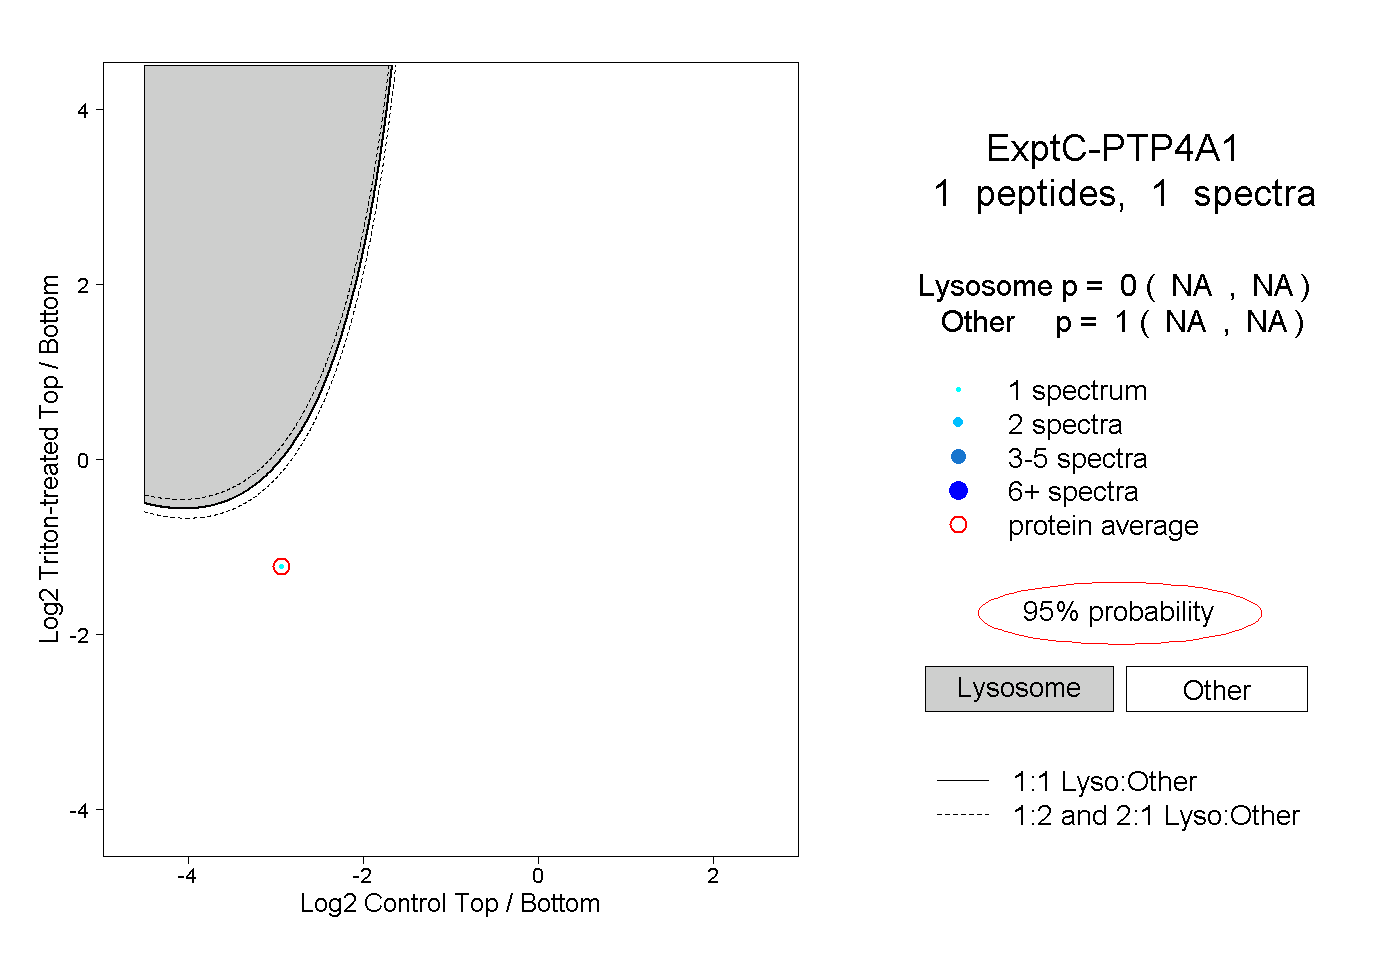
NA | NA
NA | NA
1peptide
spectra
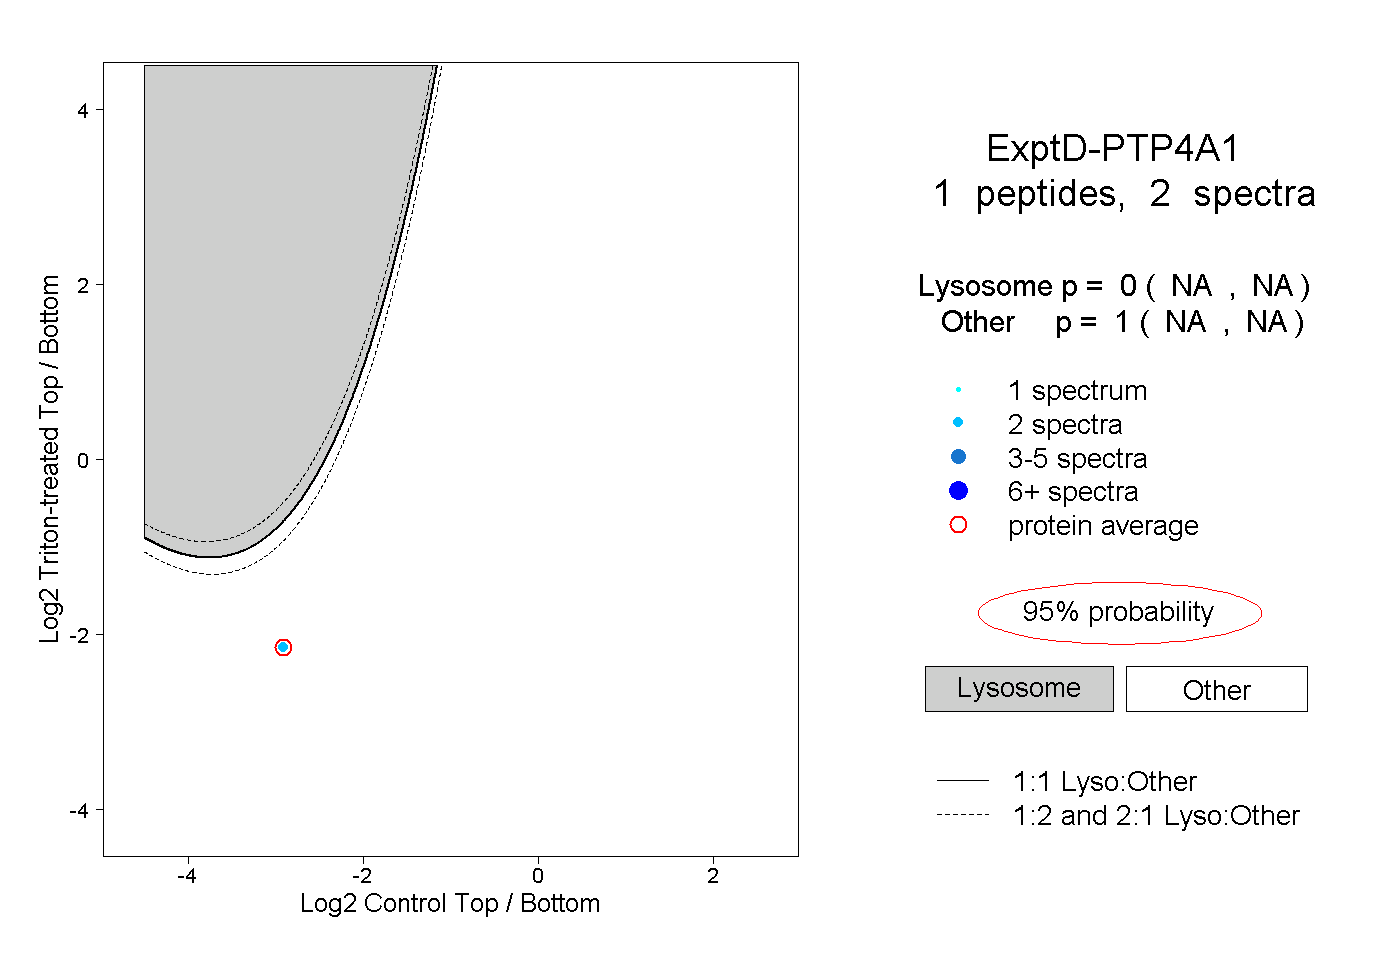
NA | NA
NA | NA