 3
3peptides
spectra
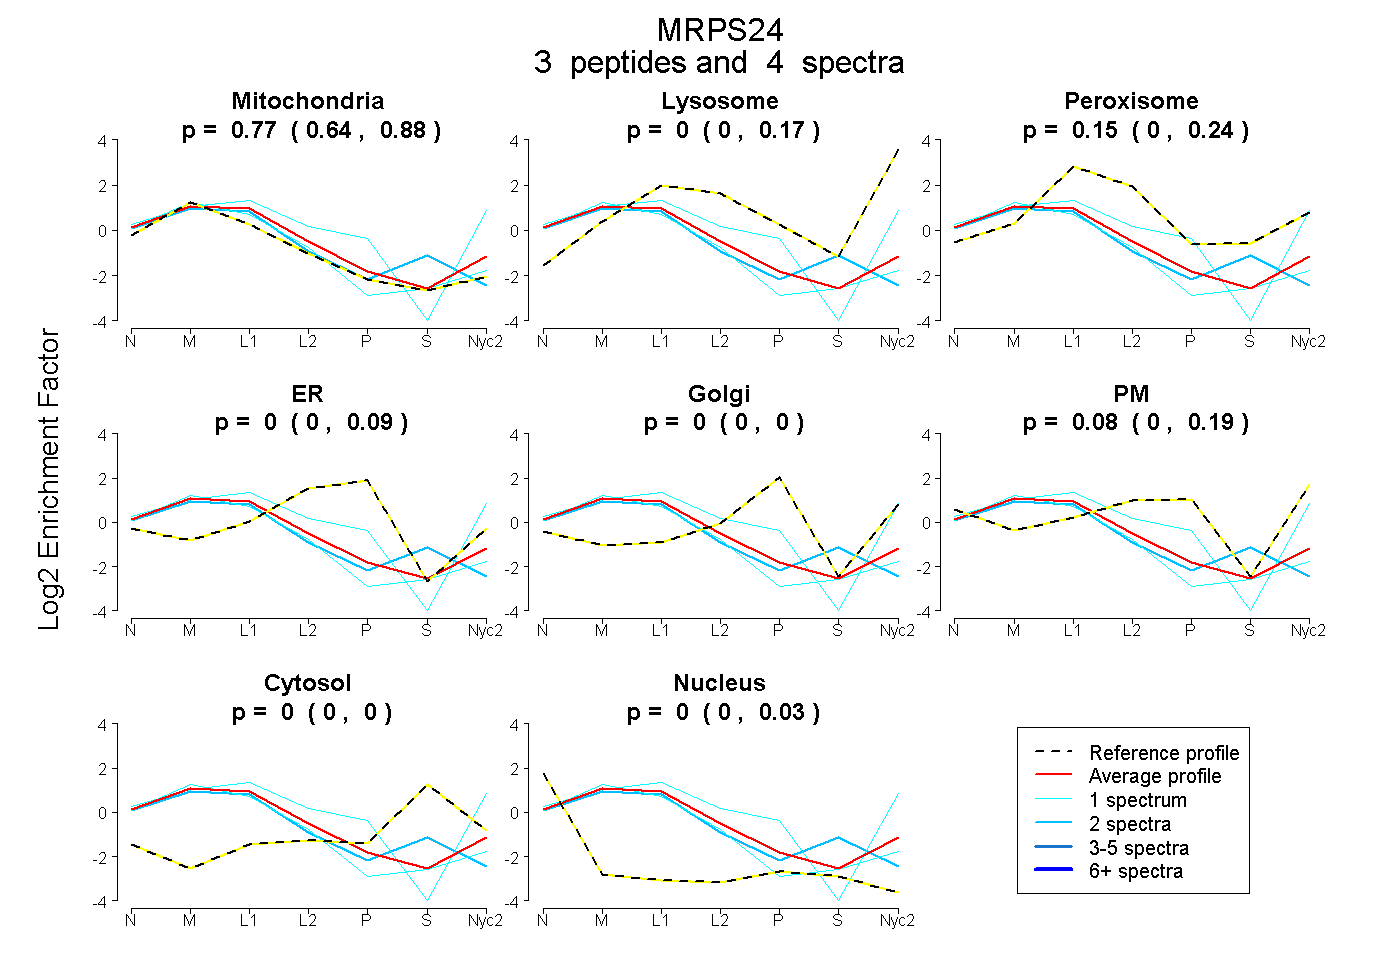
0.643 | 0.876
0.000 | 0.166
0.000 | 0.240
0.000 | 0.087
0.000 | 0.000
0.000 | 0.188
0.000 | 0.000
0.000 | 0.028
2peptides
spectra
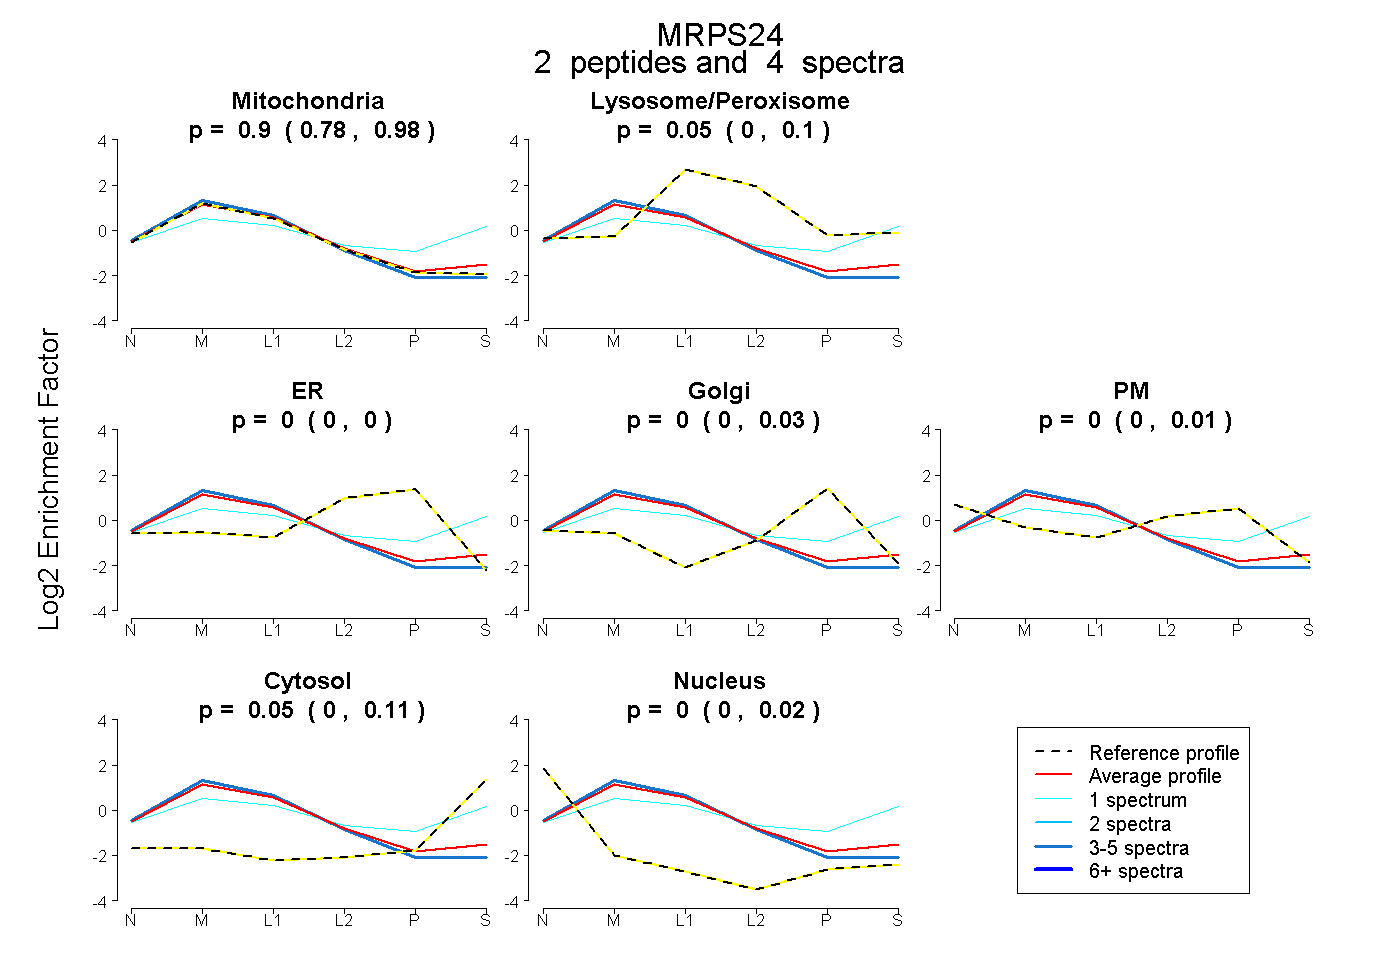
0.783 | 0.976
0.000 | 0.097
0.000 | 0.004
0.000 | 0.029
0.000 | 0.012
0.000 | 0.105
0.000 | 0.017
4peptides
spectra
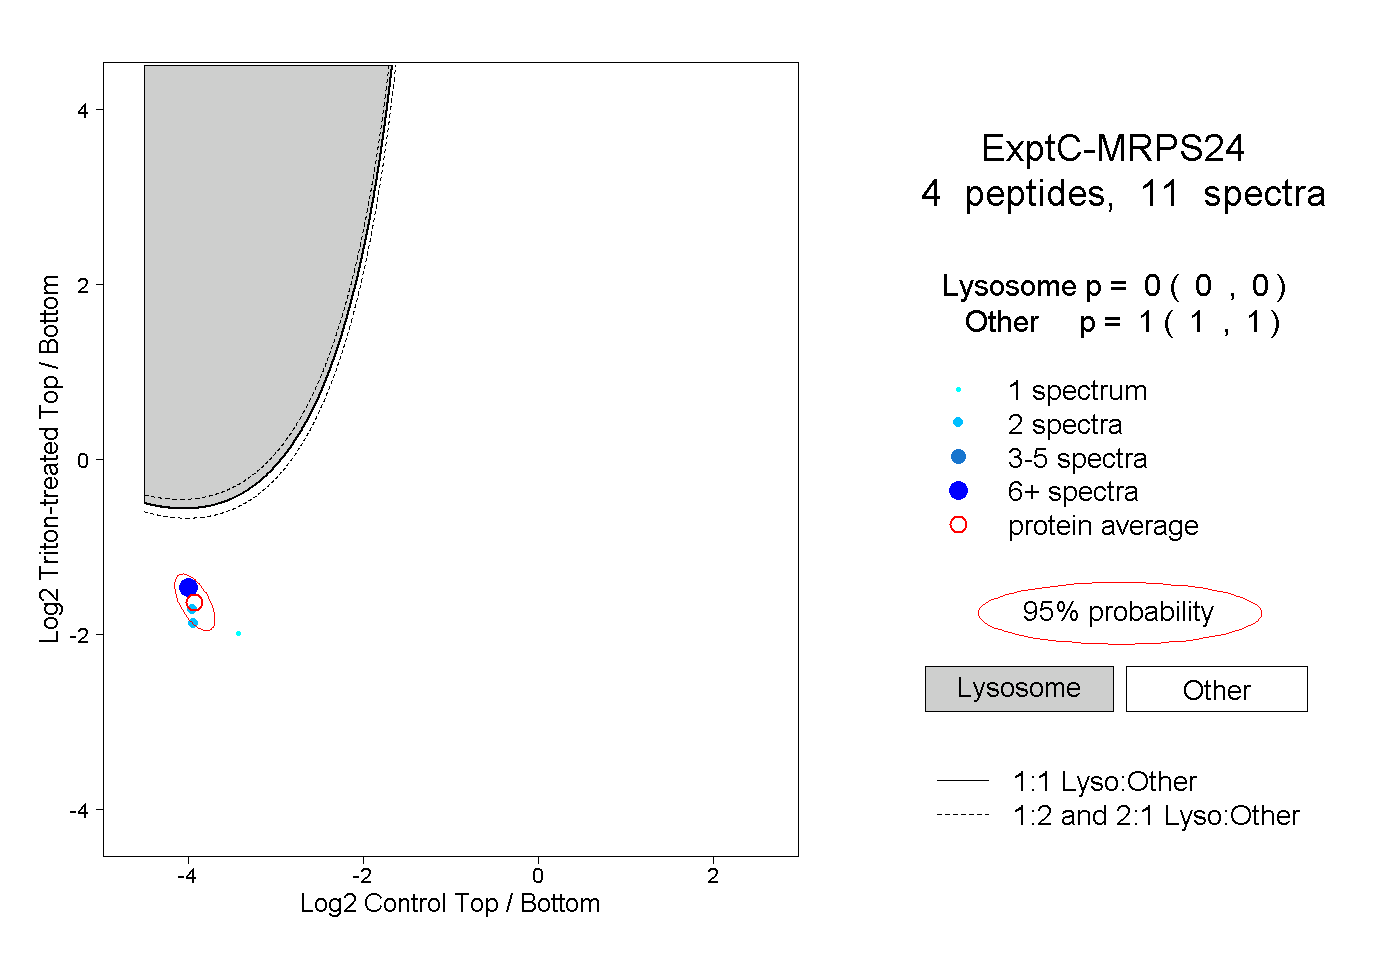
0.000 | 0.000
1.000 | 1.000
1peptide
spectra
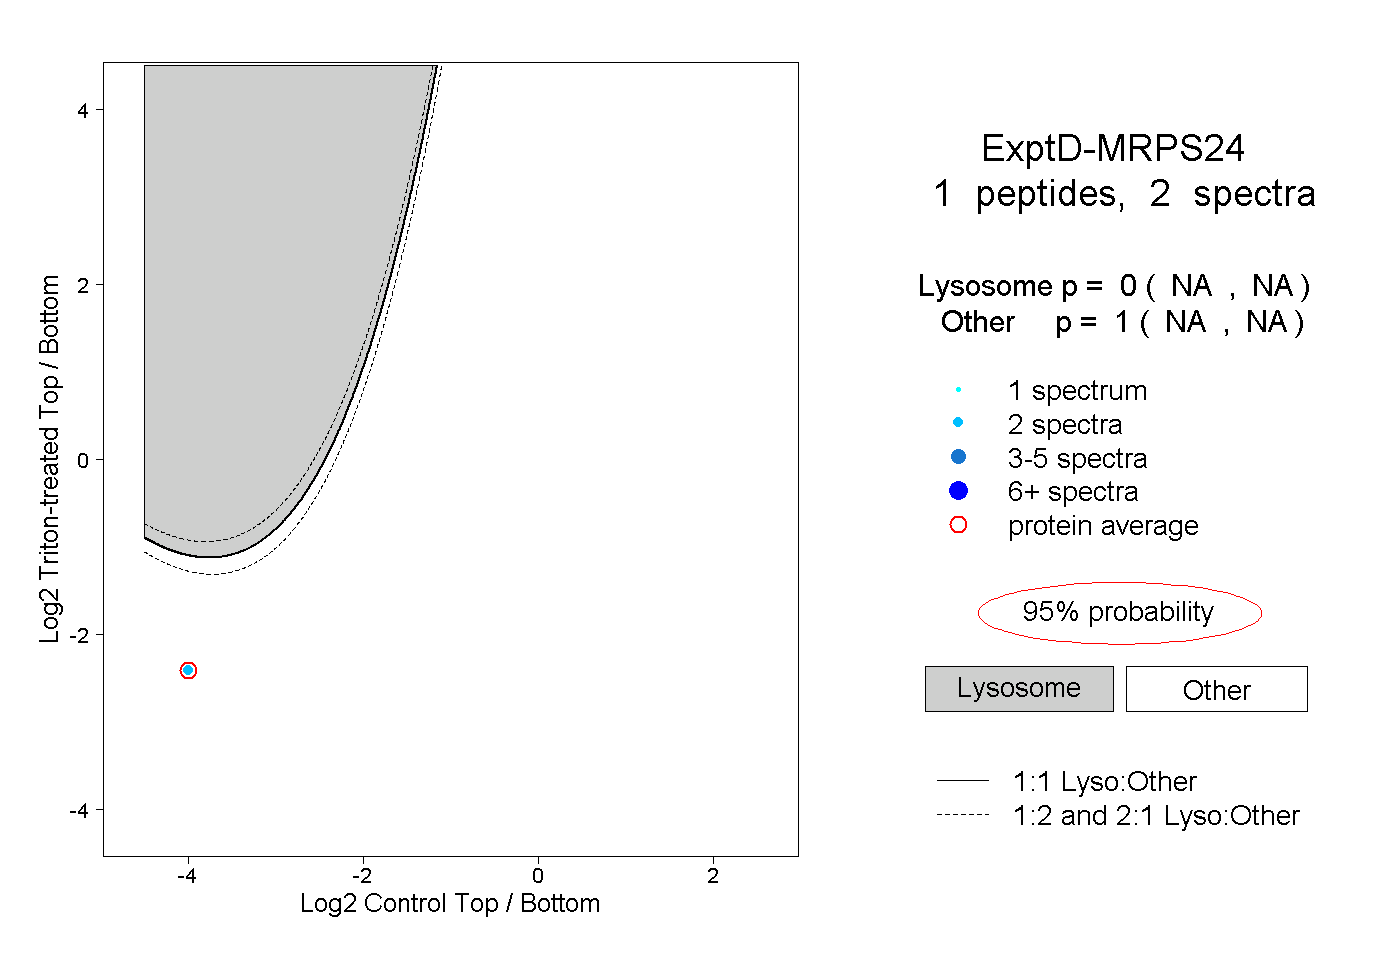
NA | NA
NA | NA