 16
16peptides
spectra
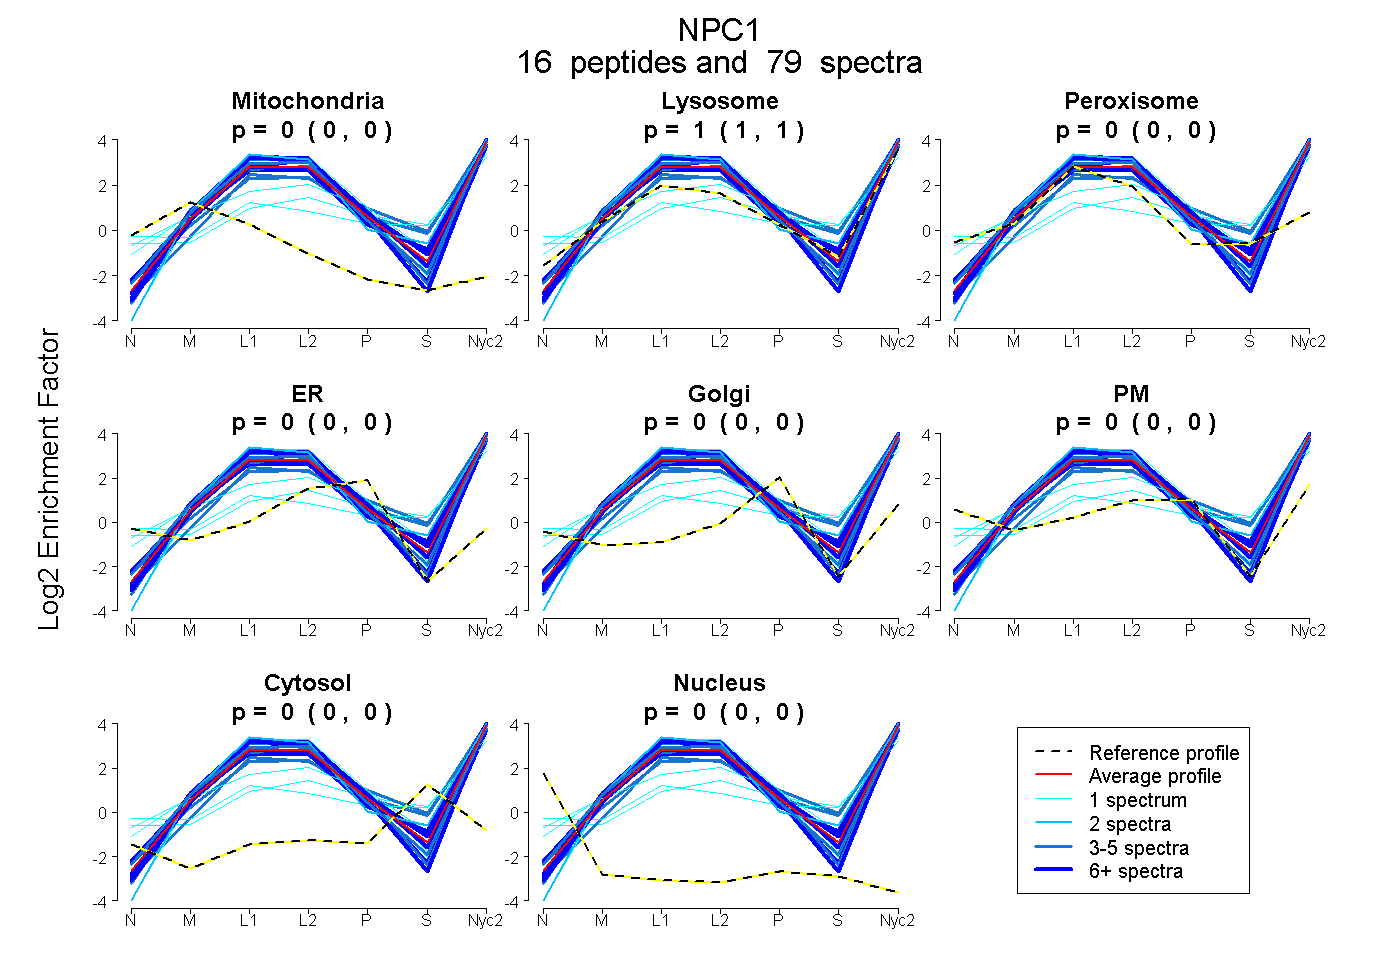
0.000 | 0.000
1.000 | 1.000
0.000 | 0.000
0.000 | 0.000
0.000 | 0.000
0.000 | 0.000
0.000 | 0.000
0.000 | 0.000
12peptides
spectra

0.000 | 0.000
0.943 | 0.974
0.023 | 0.055
0.000 | 0.000
0.000 | 0.000
0.000 | 0.000
0.000 | 0.000
20peptides
spectra
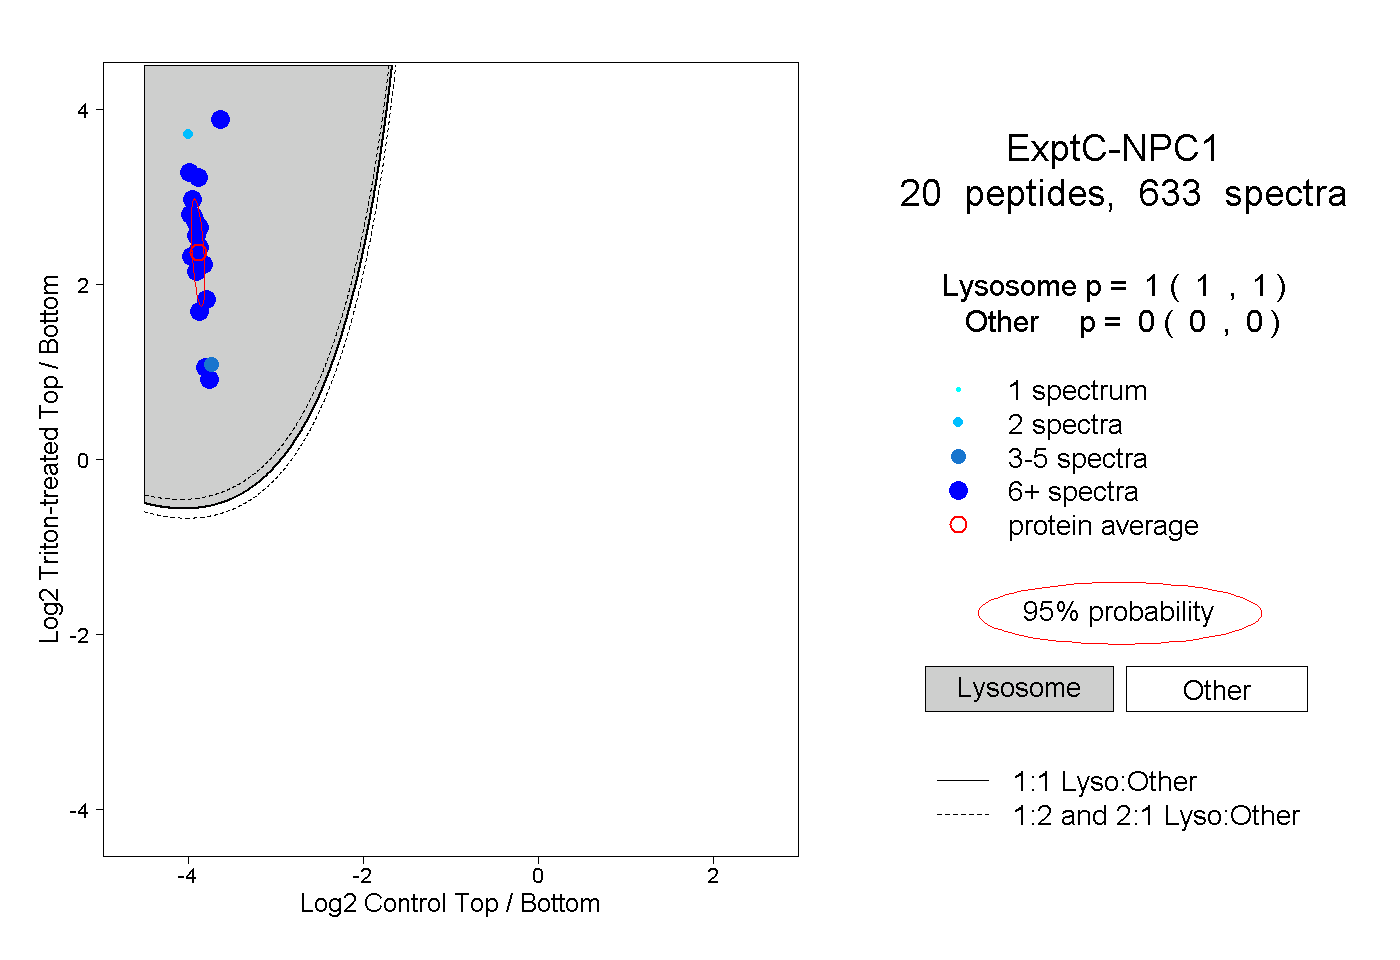
1.000 | 1.000
0.000 | 0.000
14peptides
spectra
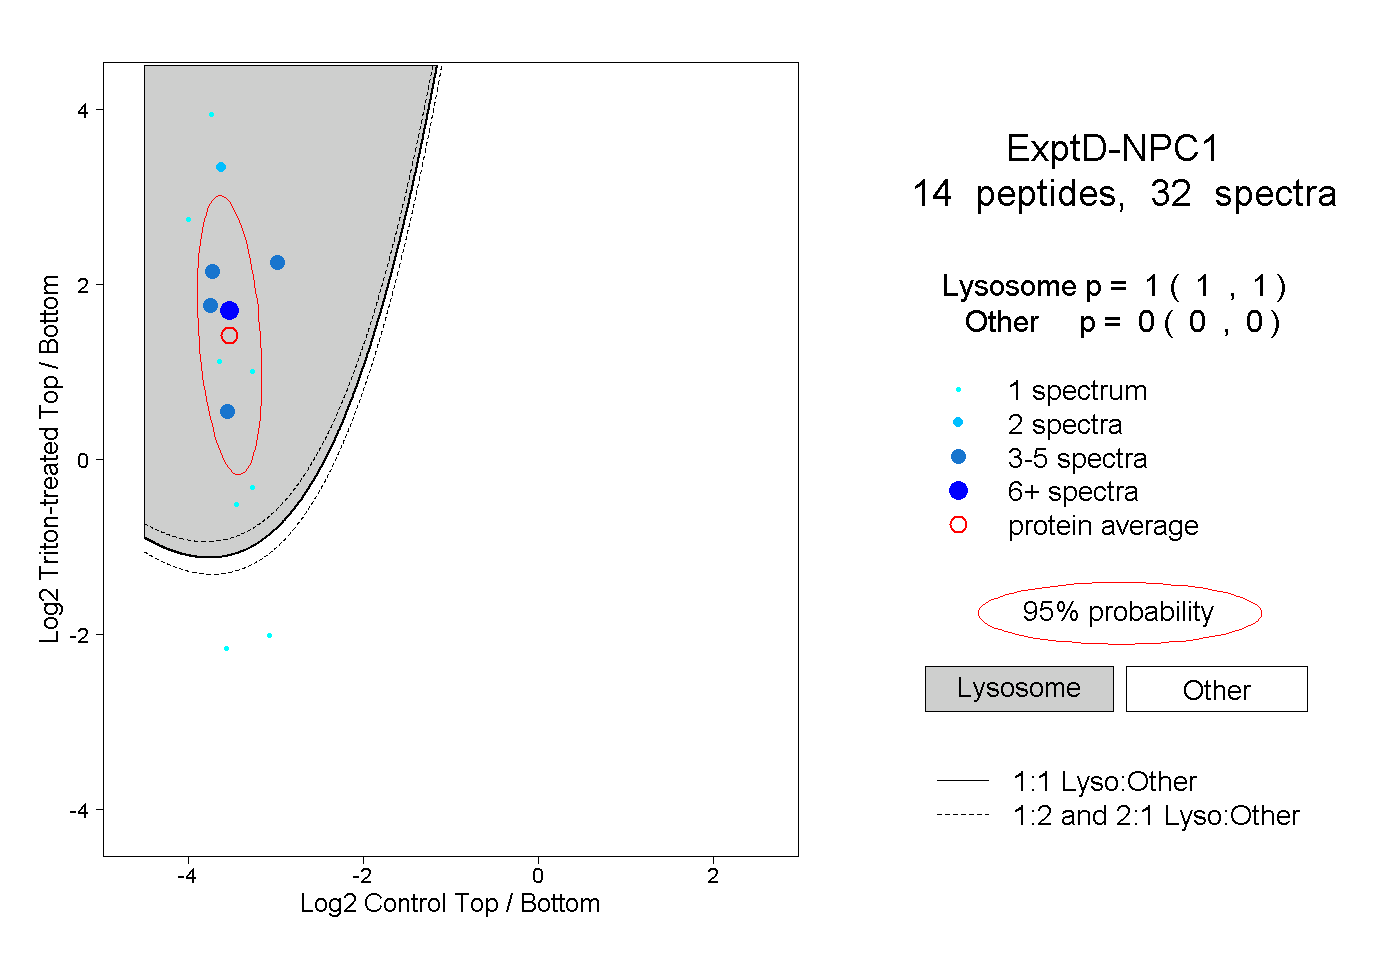
1.000 | 1.000
0.000 | 0.000