NPC1
[ENSRNOP00000016167]
Main page
| | | Plot |
Mito |
Lyso |
|
Perox |
ER |
Golgi |
PM |
Cytosol |
Nucleus |
|
| Expt A |
 16
16
peptides |
79
spectra |
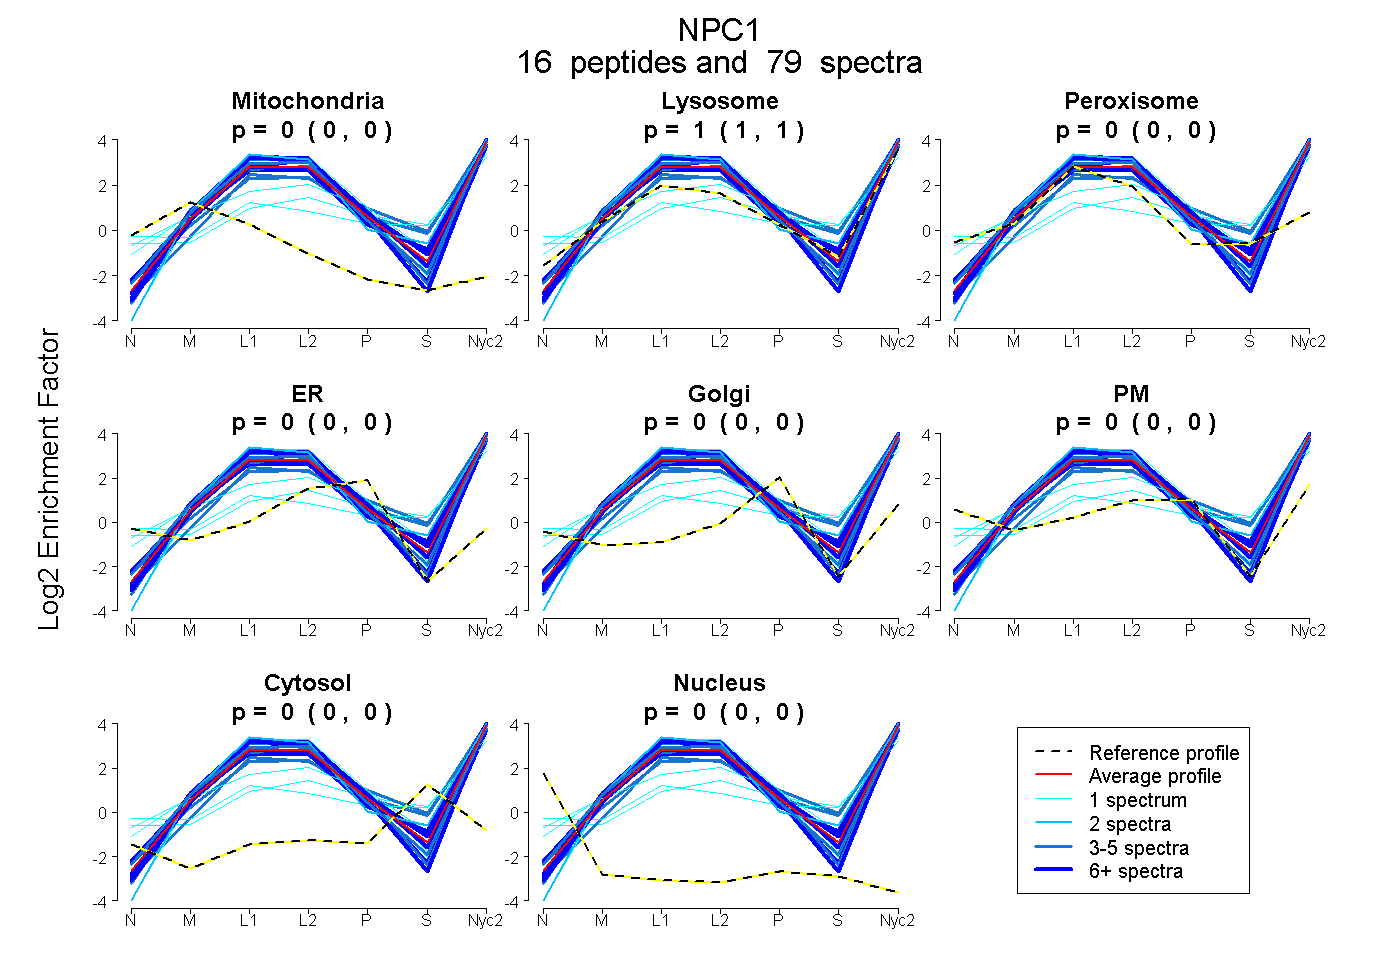 |
0.000
0.000 | 0.000 |
1.000
1.000 | 1.000 |
|
0.000
0.000 | 0.000 |
0.000
0.000 | 0.000 |
0.000
0.000 | 0.000 |
0.000
0.000 | 0.000 |
0.000
0.000 | 0.000 |
0.000
0.000 | 0.000 |
|
| | | Plot |
Mito |
|
Lyso or Perox |
|
ER |
Golgi |
PM |
Cytosol |
Nucleus |
|
| Expt B |
12
peptides |
36
spectra |
 |
0.000
0.000 | 0.000 |
|
0.960
0.943 | 0.974 |
|
0.040
0.023 | 0.055 |
0.000
0.000 | 0.000 |
0.000
0.000 | 0.000 |
0.000
0.000 | 0.000 |
0.000
0.000 | 0.000 |
|
| 2 spectra, SNLQLPLQFLSR |
0.000 |
|
0.563 |
|
0.000 |
0.262 |
0.068 |
0.106 |
0.000 |
|
| 1 spectrum, AWAWEK |
0.000 |
|
1.000 |
|
0.000 |
0.000 |
0.000 |
0.000 |
0.000 |
|
| 6 spectra, SLEDEINR |
0.000 |
|
0.850 |
|
0.150 |
0.000 |
0.000 |
0.000 |
0.000 |
|
| 5 spectra, LQEETLDQQLGR |
0.000 |
|
0.960 |
|
0.008 |
0.000 |
0.032 |
0.000 |
0.000 |
|
| 2 spectra, FLPMFLSDNPNPK |
0.199 |
|
0.466 |
|
0.000 |
0.000 |
0.214 |
0.121 |
0.000 |
|
| 2 spectra, WGAFCVR |
0.000 |
|
0.997 |
|
0.003 |
0.000 |
0.000 |
0.000 |
0.000 |
|
| 2 spectra, ALGLLCGR |
0.000 |
|
1.000 |
|
0.000 |
0.000 |
0.000 |
0.000 |
0.000 |
|
| 1 spectrum, CRPLTPEGK |
0.000 |
|
0.936 |
|
0.064 |
0.000 |
0.000 |
0.000 |
0.000 |
|
| 4 spectra, EFINFVK |
0.000 |
|
1.000 |
|
0.000 |
0.000 |
0.000 |
0.000 |
0.000 |
|
| 1 spectrum, TSADYIDALK |
0.000 |
|
1.000 |
|
0.000 |
0.000 |
0.000 |
0.000 |
0.000 |
|
| 5 spectra, HFGPFFR |
0.000 |
|
0.997 |
|
0.003 |
0.000 |
0.000 |
0.000 |
0.000 |
|
| 5 spectra, ELEYYVGR |
0.000 |
|
1.000 |
|
0.000 |
0.000 |
0.000 |
0.000 |
0.000 |
|
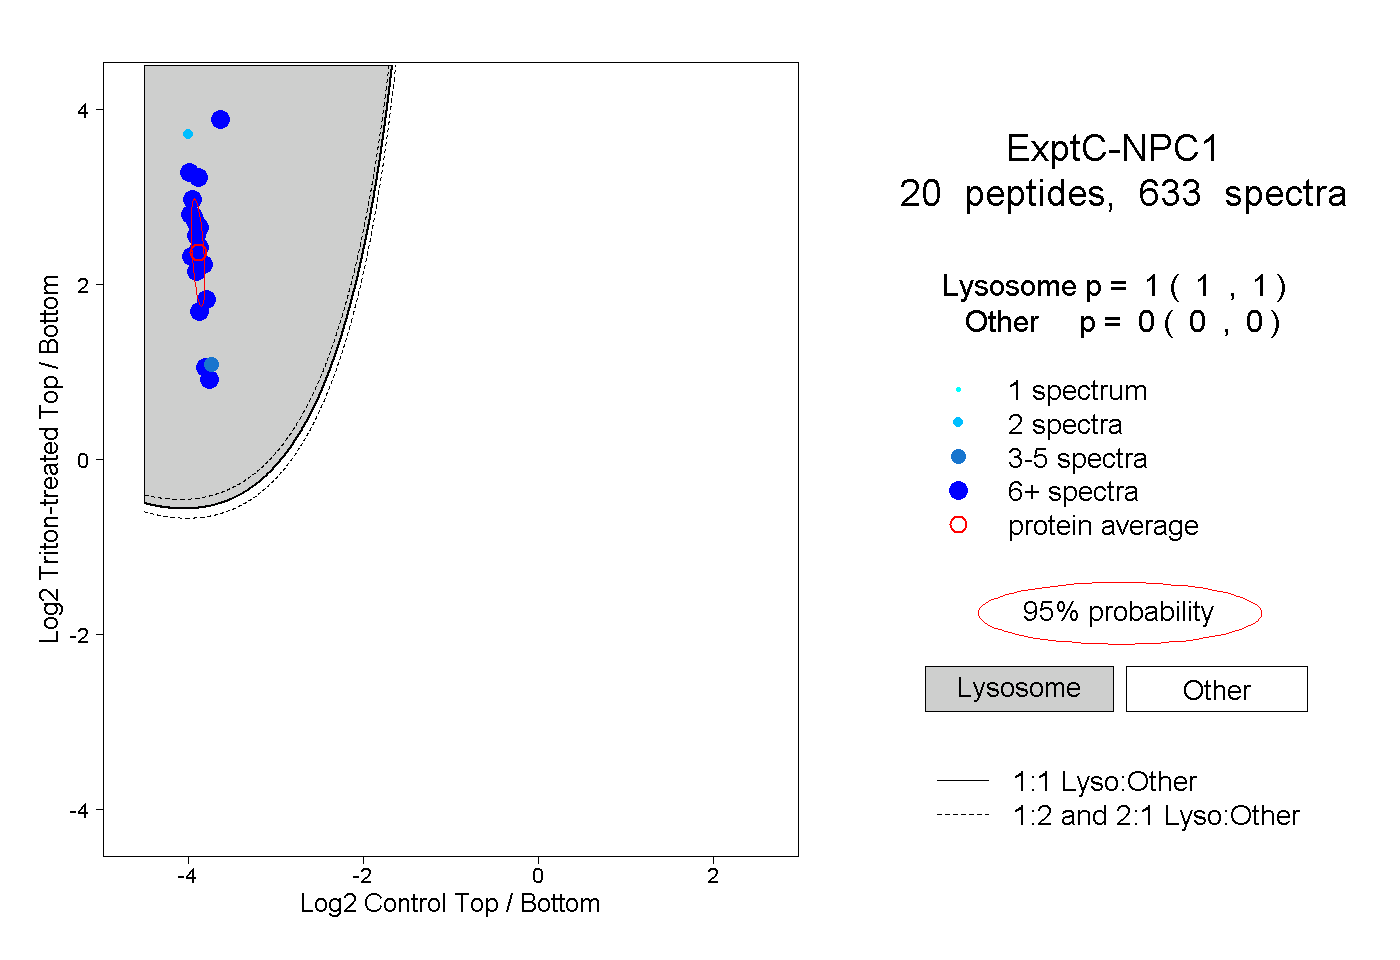
| | | Plot |
|
Lyso |
|
|
|
|
|
|
|
Other |
| Expt C |
20
peptides |
633
spectra |
 |
|
1.000
1.000 | 1.000 |
|
|
|
|
|
|
|
0.000
0.000 | 0.000 |
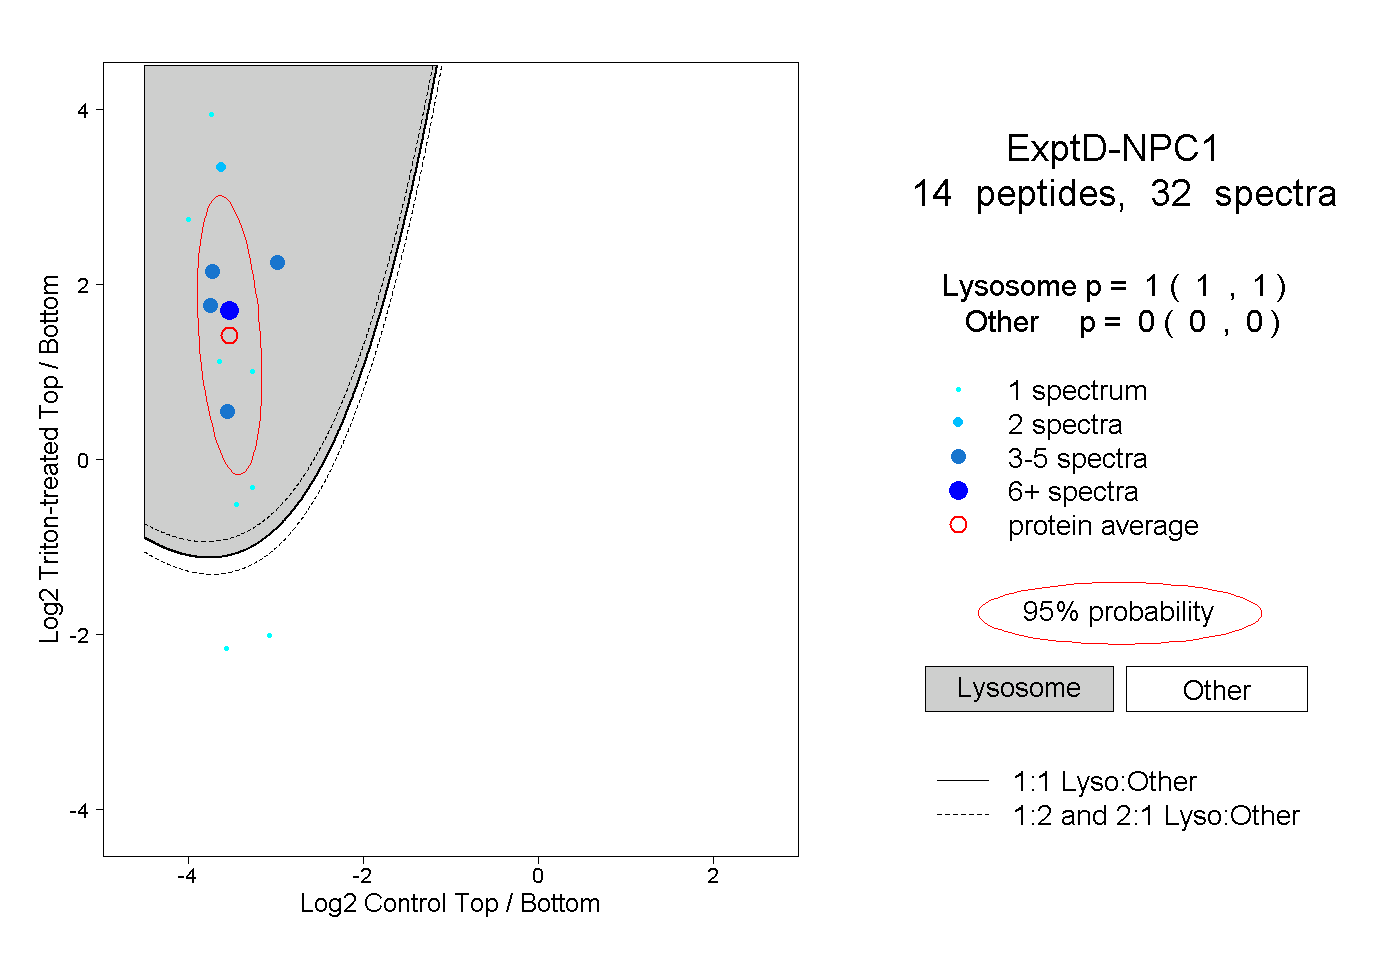
| | | Plot |
|
Lyso |
|
|
|
|
|
|
|
Other |
| Expt D |
14
peptides |
32
spectra |
 |
|
1.000
1.000 | 1.000 |
|
|
|
|
|
|
|
0.000
0.000 | 0.000 |