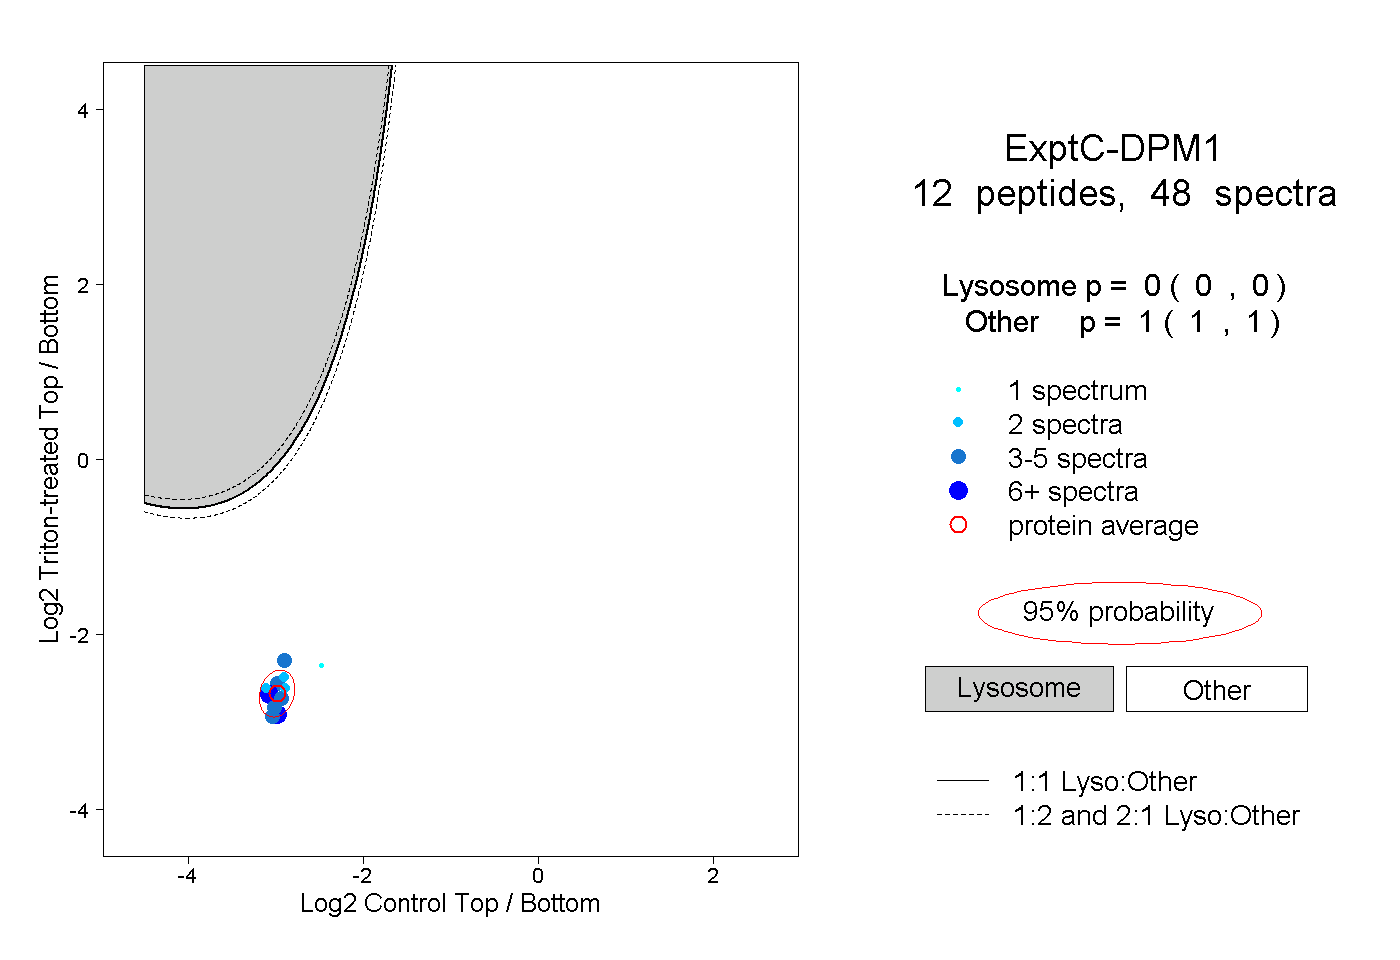
12
12peptides
spectra
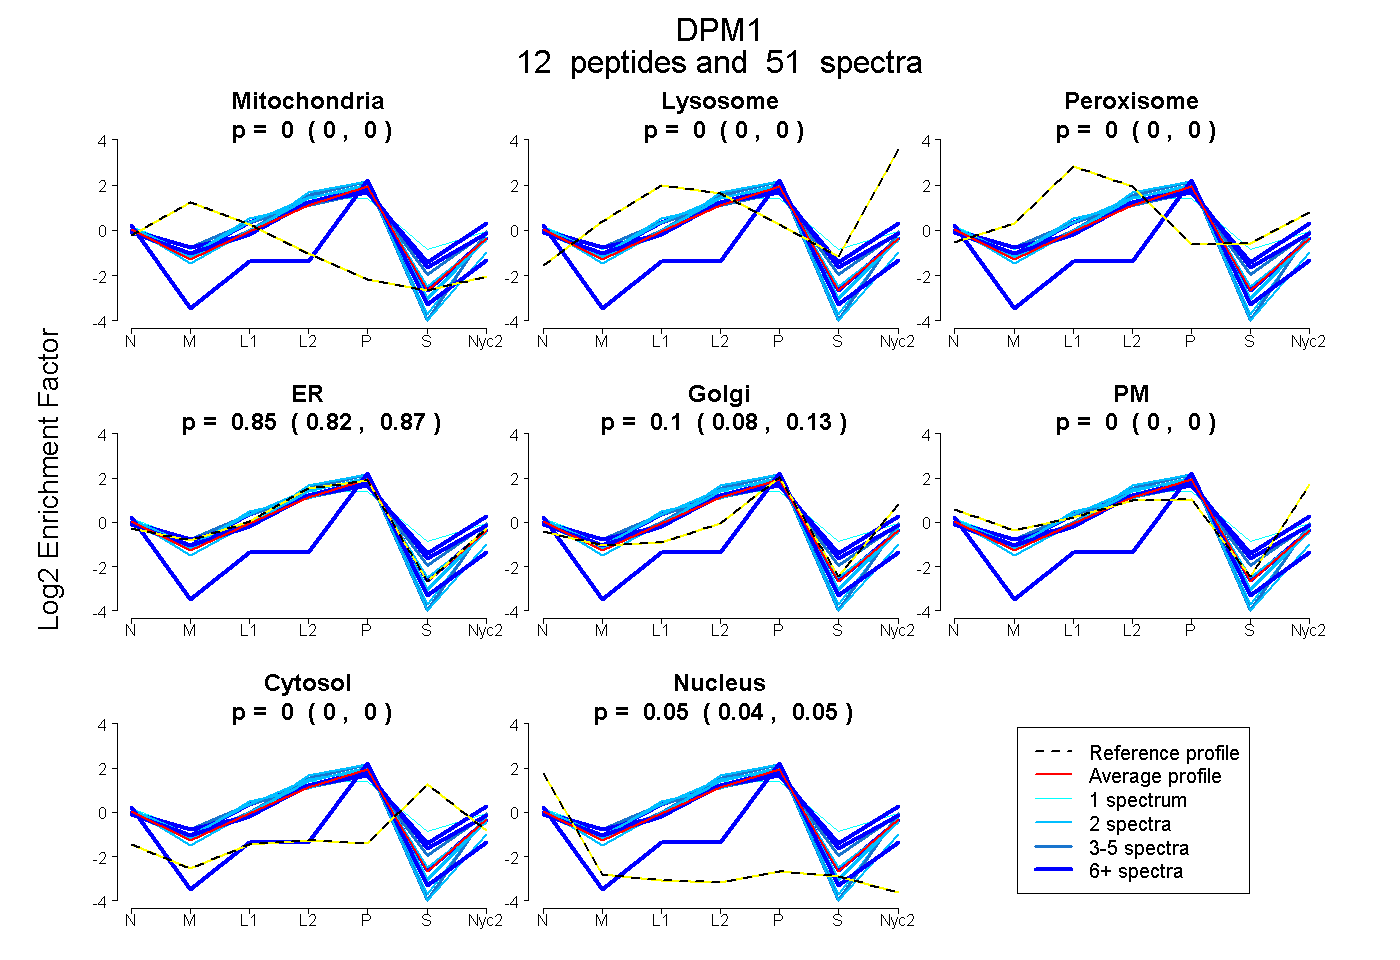
0.000 | 0.000
0.000 | 0.000
0.000 | 0.000
0.822 | 0.869
0.081 | 0.125
0.000 | 0.000
0.000 | 0.000
0.042 | 0.051
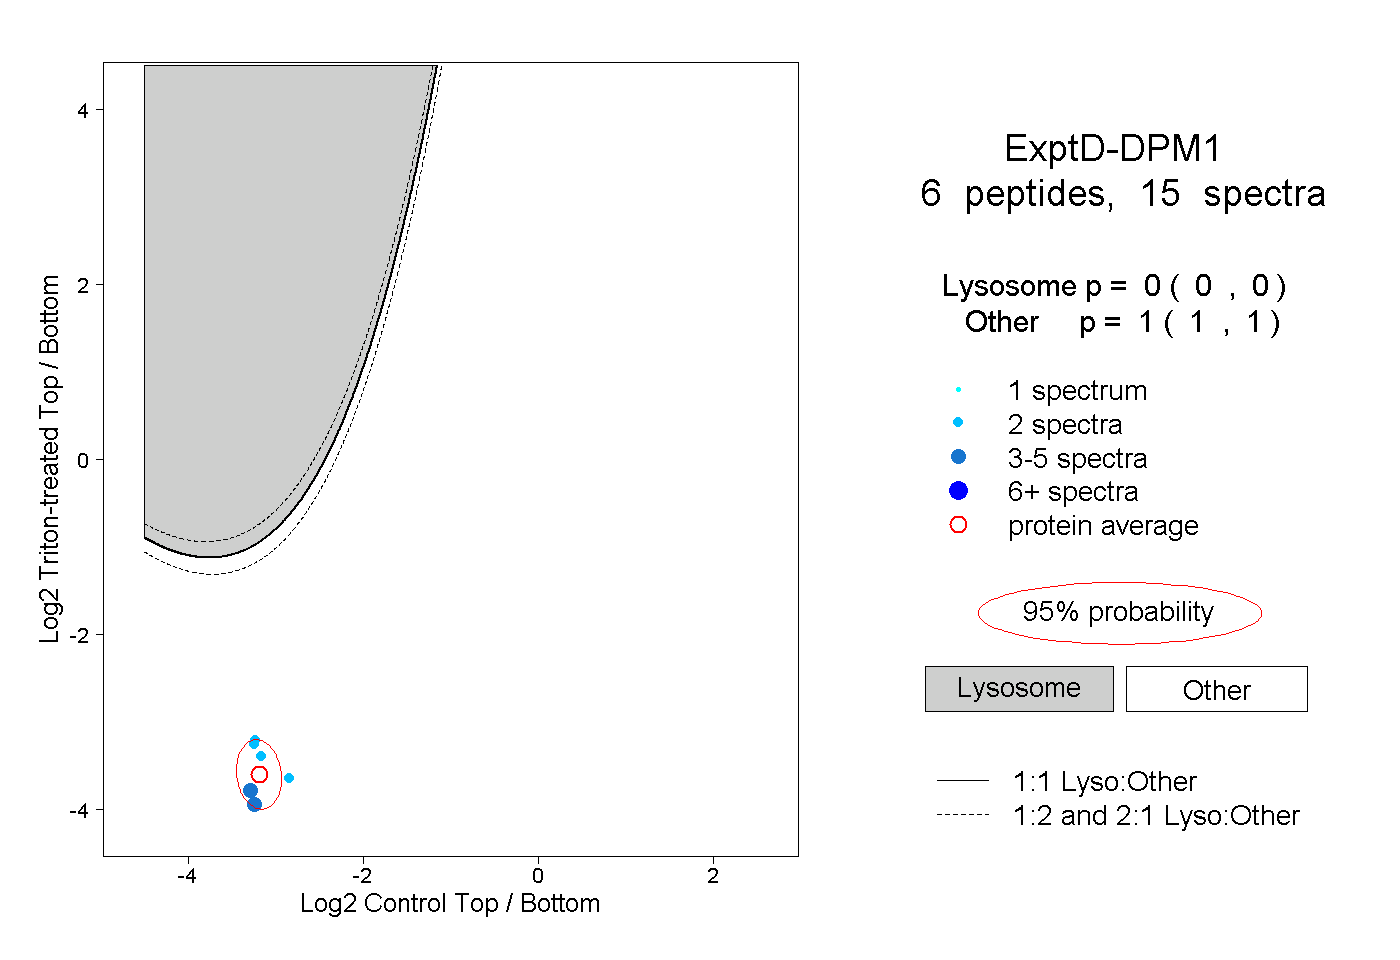
5peptides
spectra
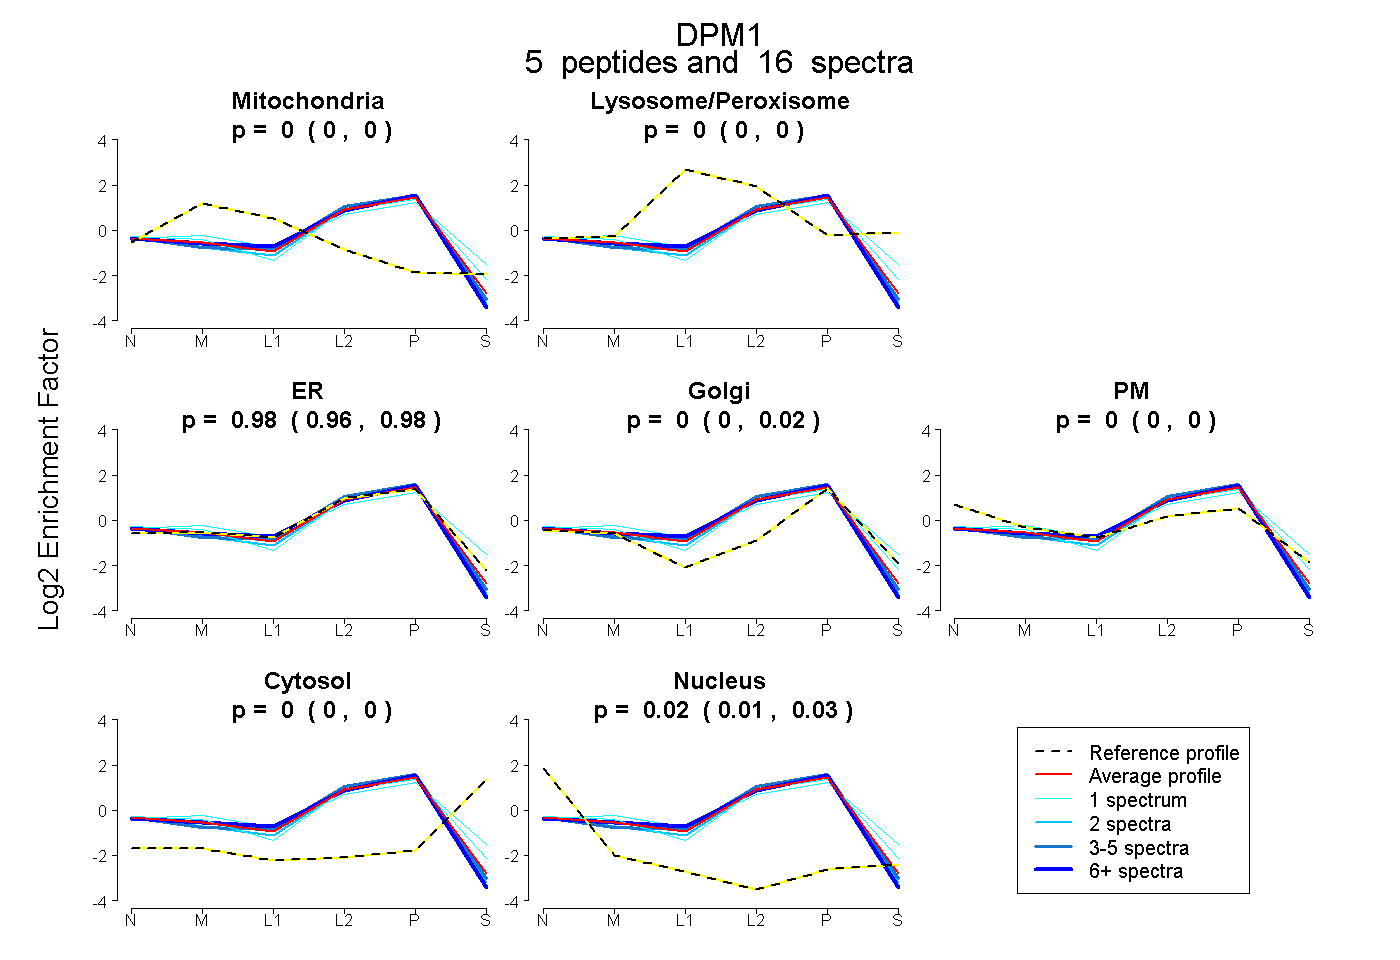
0.000 | 0.000
0.000 | 0.000
0.955 | 0.981
0.000 | 0.024
0.000 | 0.000
0.000 | 0.000
0.014 | 0.026