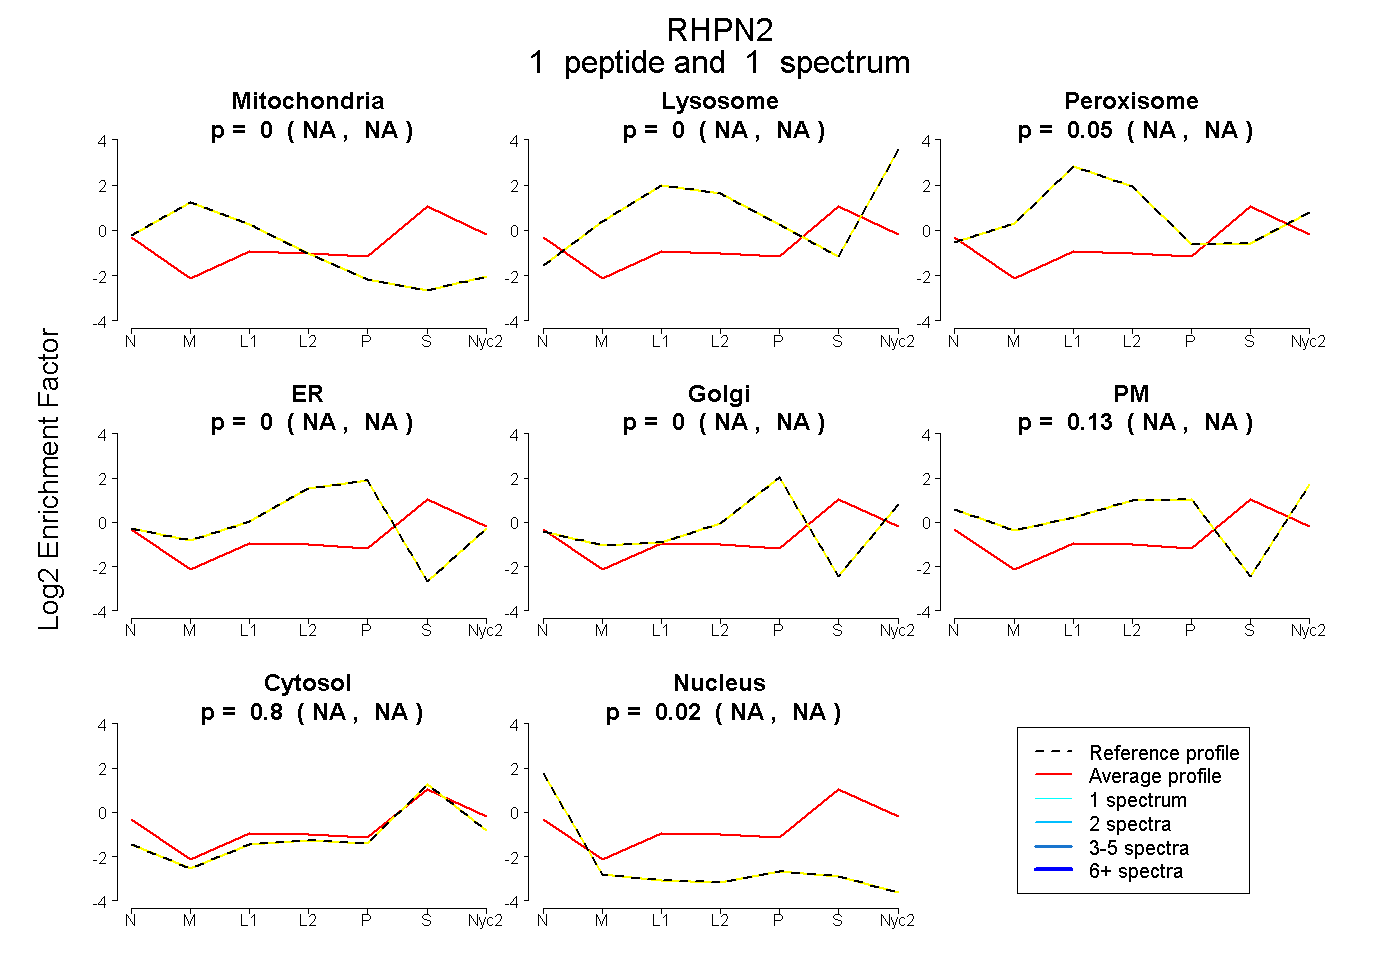
 1
1peptide
spectrum
NA | NA
NA | NA
NA | NA
NA | NA
NA | NA
NA | NA
NA | NA
NA | NA
| Plot | Mito | Lyso | Perox | ER | Golgi | PM | Cytosol | Nucleus | |||||
| Expt A |
1 peptide |
1 spectrum |
|
0.000 NA | NA |
0.000 NA | NA |
0.053 NA | NA |
0.000 NA | NA |
0.000 NA | NA |
0.132 NA | NA |
0.795 NA | NA |
0.019 NA | NA |
| 1 spectrum, ESDDYFR | 0.000 | 0.000 | 0.053 | 0.000 | 0.000 | 0.132 | 0.795 | 0.019 |
| Plot | Lyso | Other | |||||||||||
| Expt C |
1 peptide |
1 spectrum |
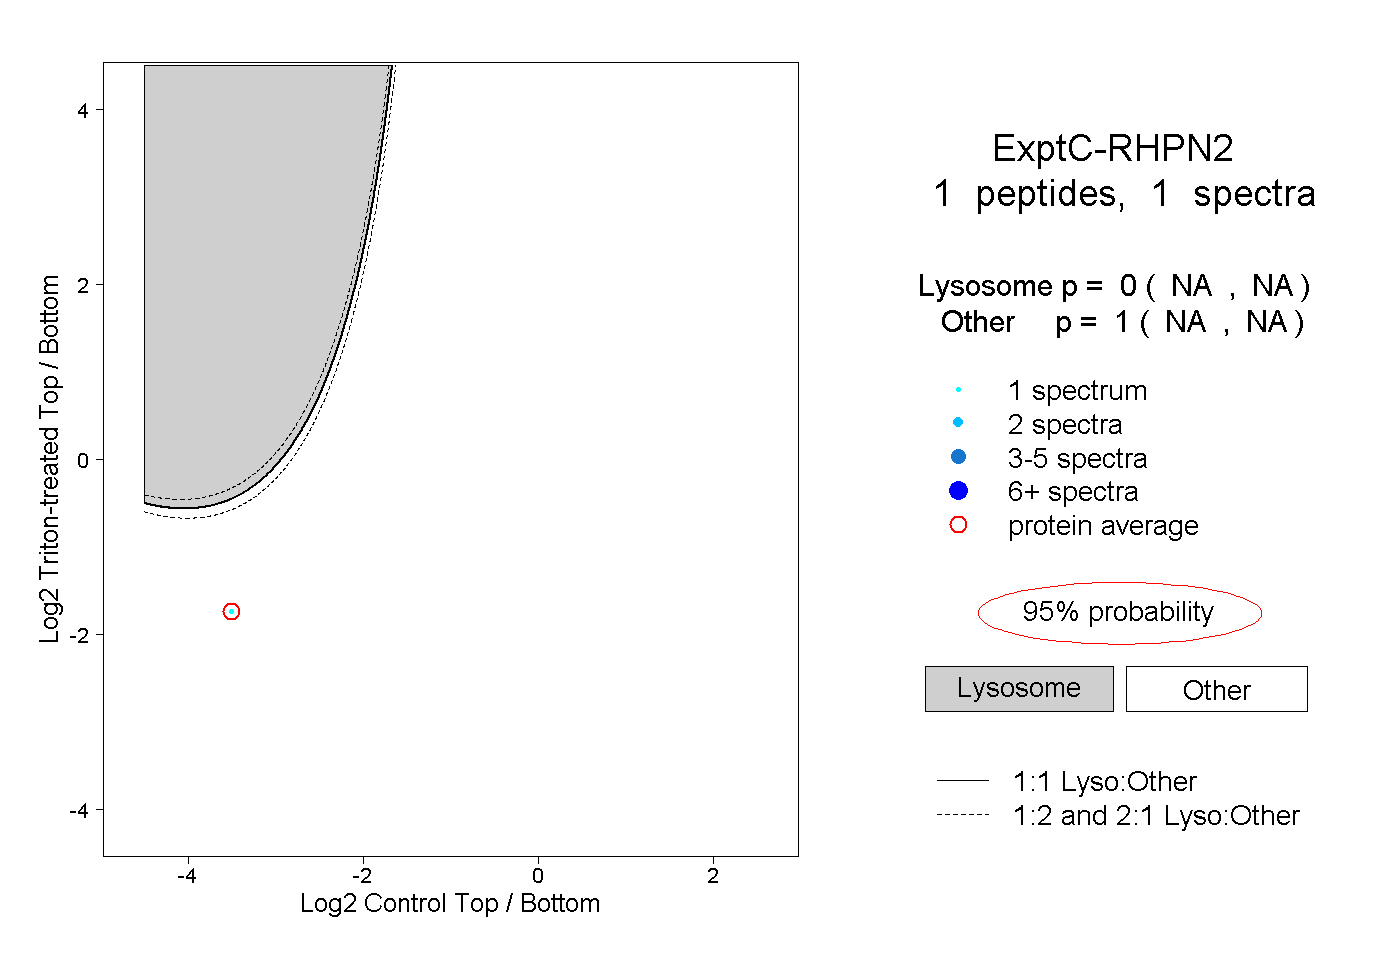 |
0.000 NA | NA |
1.000 NA | NA |