 4
4peptides
spectra
0.000 | 0.000
0.000 | 0.000
0.000 | 0.043
0.000 | 0.074
0.000 | 0.055
0.000 | 0.078
0.246 | 0.324
0.608 | 0.695
1peptide
spectrum

NA | NA
NA | NA
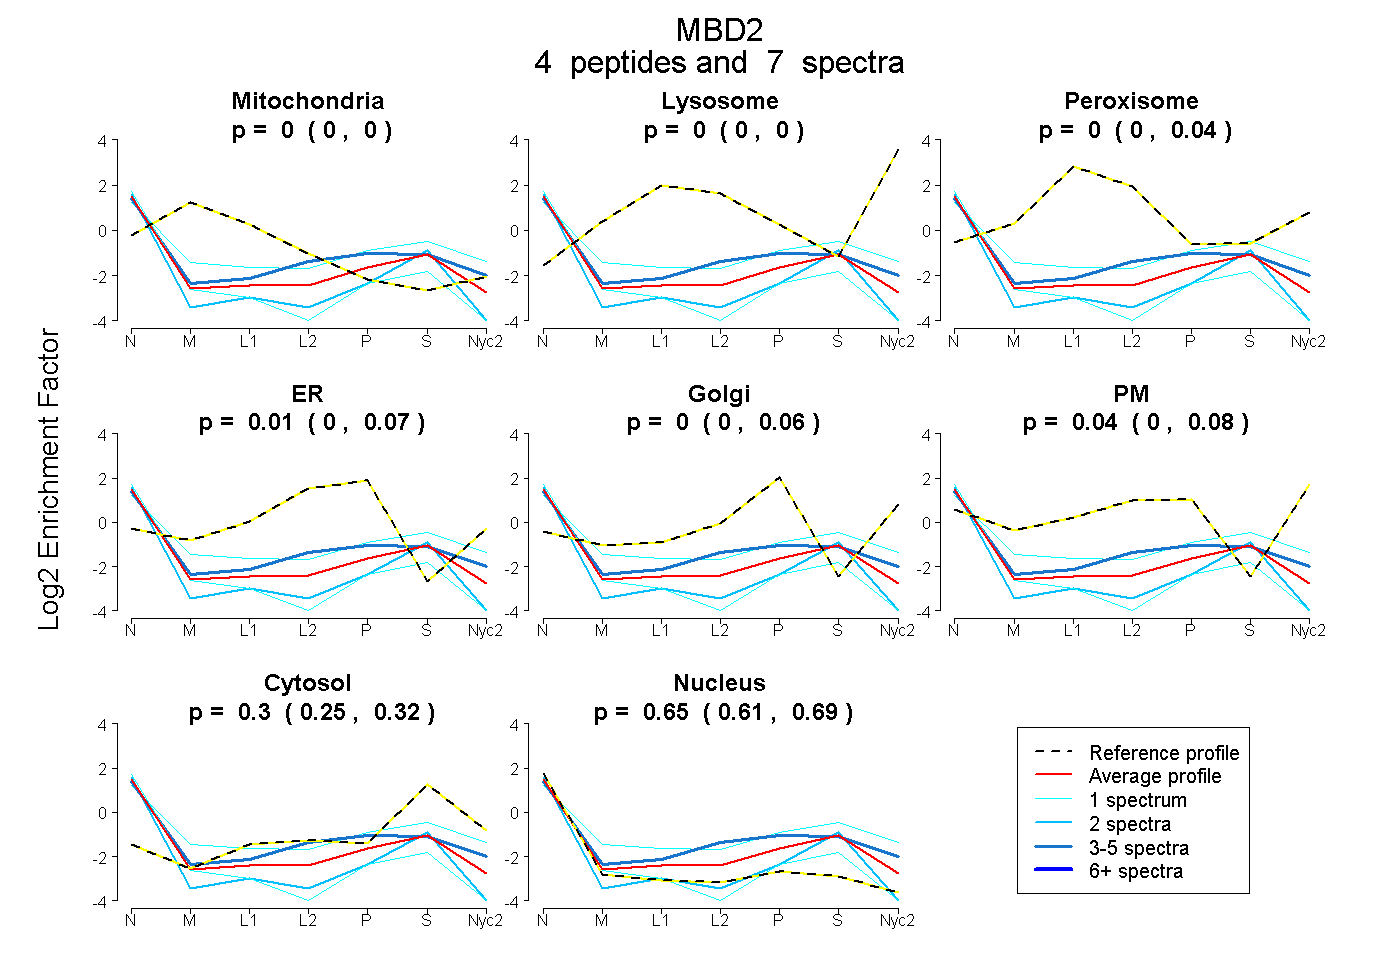
| Plot | Mito | Lyso | Perox | ER | Golgi | PM | Cytosol | Nucleus | |||||
| Expt A |
4 peptides |
7 spectra |
|
0.000 0.000 | 0.000 |
0.000 0.000 | 0.000 |
0.000 0.000 | 0.043 |
0.010 0.000 | 0.074 |
0.000 0.000 | 0.055 |
0.038 0.000 | 0.078 |
0.299 0.246 | 0.324 |
0.653 0.608 | 0.695 |
||
| Plot | Lyso | Other | |||||||||||
| Expt C |
1 peptide |
1 spectrum |
|
0.000 NA | NA |
1.000 NA | NA |