 3
3peptides
spectra
0.000 | 0.000
0.083 | 0.135
0.000 | 0.000
0.000 | 0.000
0.000 | 0.028
0.000 | 0.015
0.854 | 0.896
0.000 | 0.000
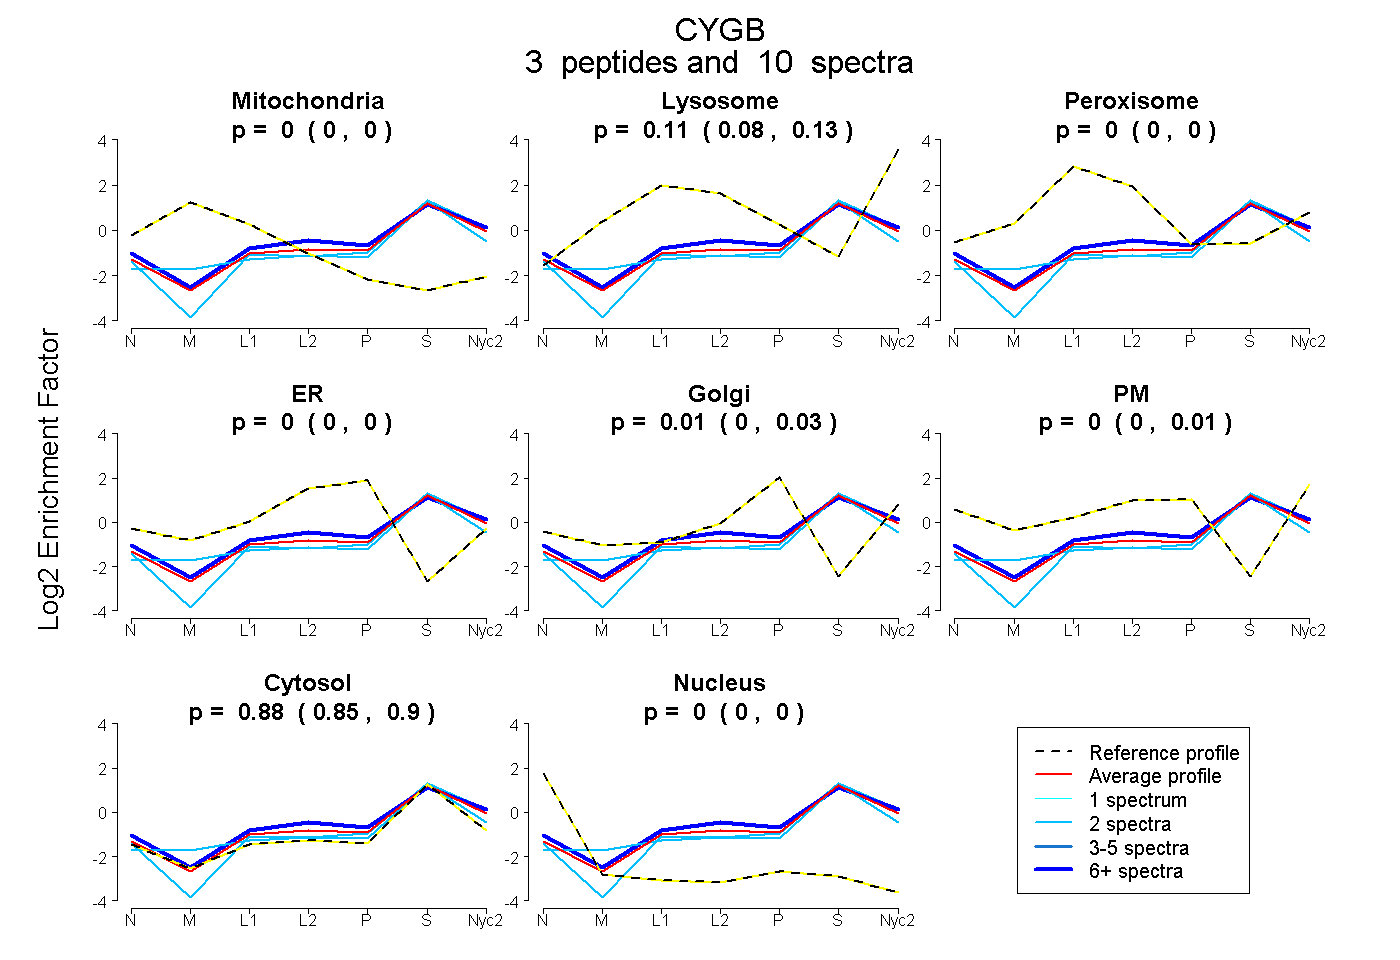
| Plot | Mito | Lyso | Perox | ER | Golgi | PM | Cytosol | Nucleus | |||||
| Expt A |
3 peptides |
10 spectra |
|
0.000 0.000 | 0.000 |
0.113 0.083 | 0.135 |
0.000 0.000 | 0.000 |
0.000 0.000 | 0.000 |
0.009 0.000 | 0.028 |
0.000 0.000 | 0.015 |
0.878 0.854 | 0.896 |
0.000 0.000 | 0.000 |
| 2 spectra, AVQATWAR | 0.000 | 0.043 | 0.000 | 0.000 | 0.000 | 0.000 | 0.957 | 0.000 | ||
| 6 spectra, HMEDPLEMER | 0.000 | 0.138 | 0.000 | 0.000 | 0.000 | 0.063 | 0.800 | 0.000 | ||
| 2 spectra, VPGDMEIER | 0.020 | 0.085 | 0.000 | 0.000 | 0.000 | 0.000 | 0.894 | 0.000 |
| Plot | Mito | Lyso or Perox | ER | Golgi | PM | Cytosol | Nucleus | ||||||
| Expt B |
1 peptide |
2 spectra |
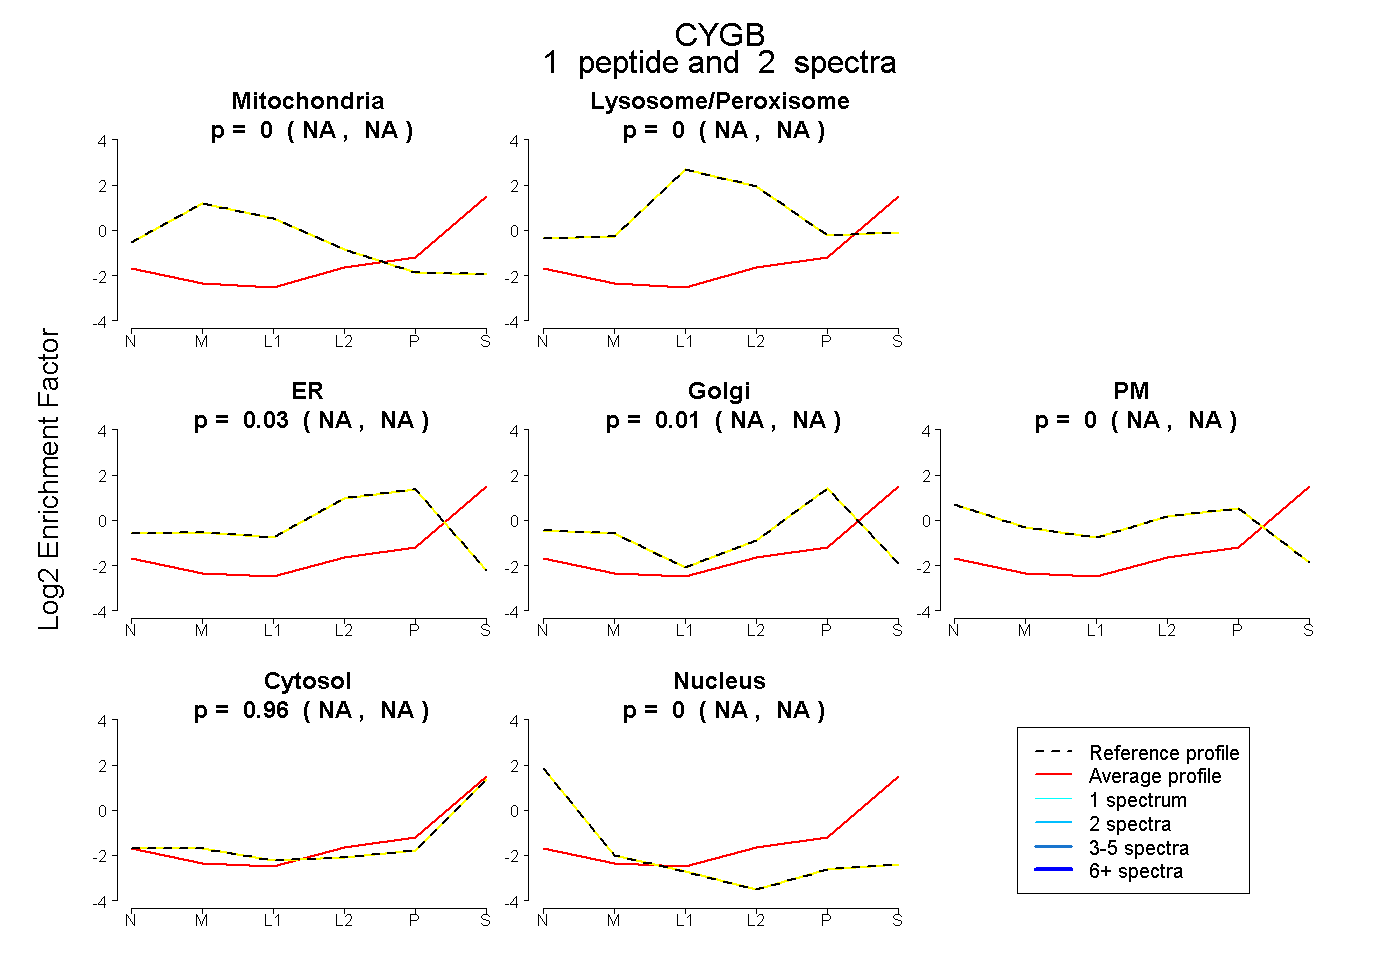 |
0.000 NA | NA |
0.000 NA | NA |
0.031 NA | NA |
0.014 NA | NA |
0.000 NA | NA |
0.956 NA | NA |
0.000 NA | NA |
|||
| Plot | Lyso | Other | |||||||||||
| Expt C |
1 peptide |
2 spectra |
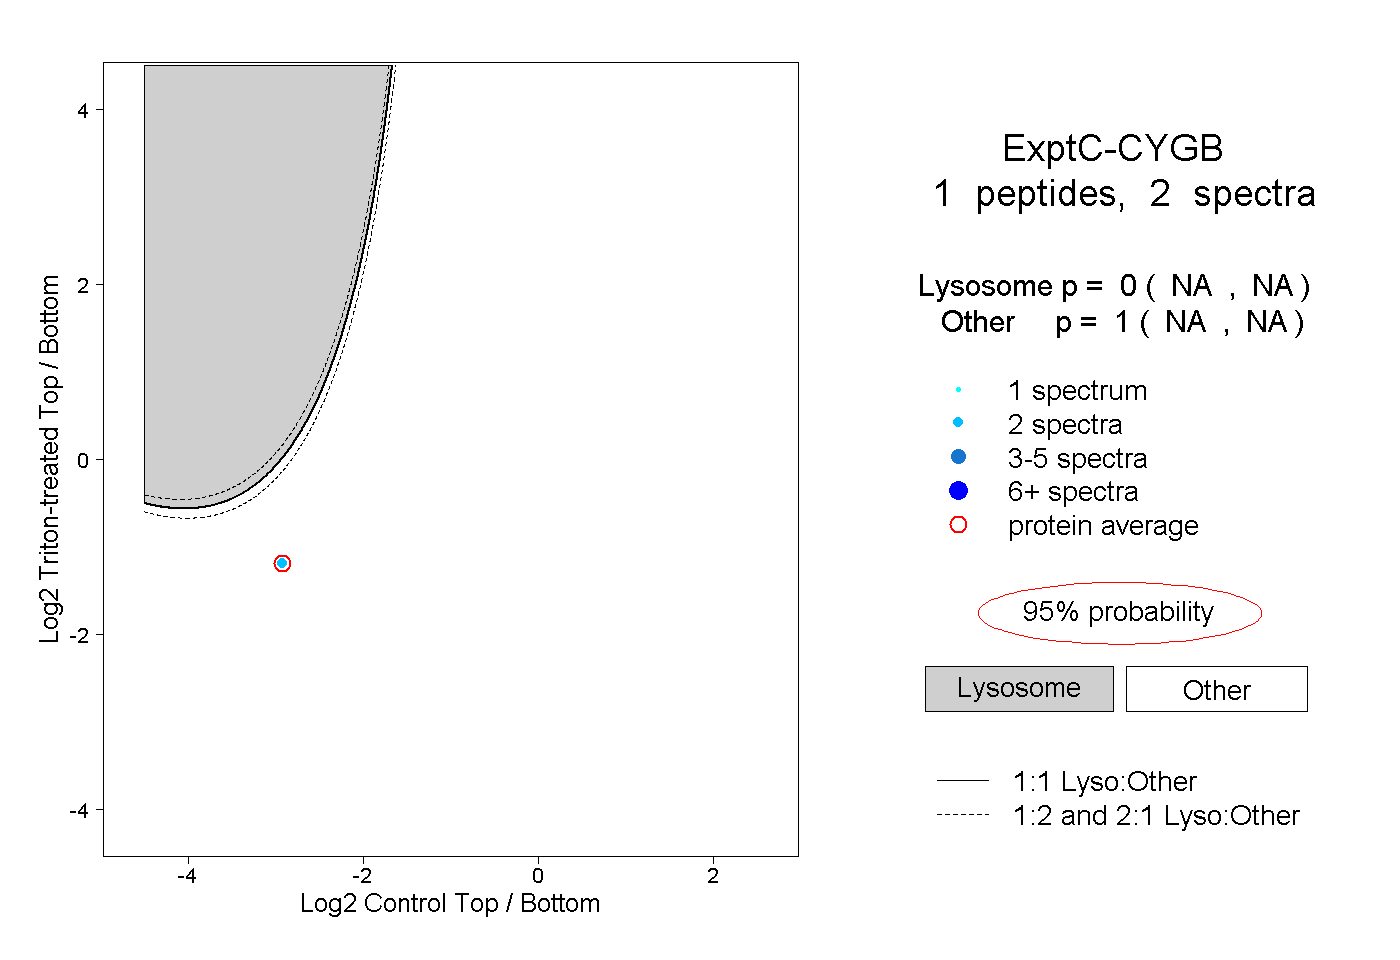 |
0.000 NA | NA |
1.000 NA | NA |
||||||||
| Plot | Lyso | Other | |||||||||||
| Expt D |
1 peptide |
1 spectrum |
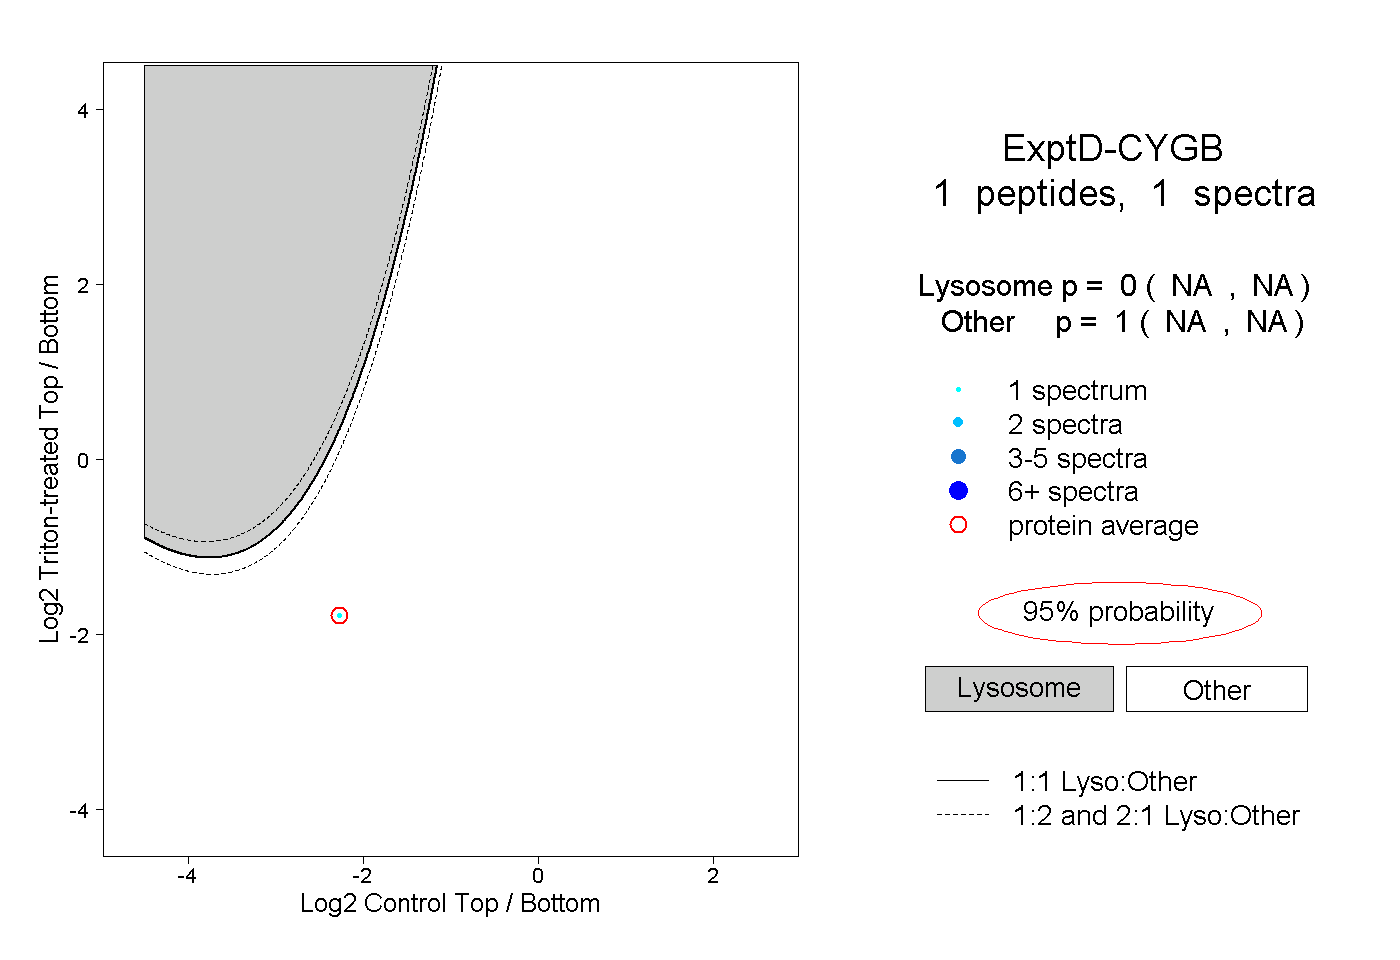 |
0.000 NA | NA |
1.000 NA | NA |