 5
5peptides
spectra
0.758 | 0.803
0.000 | 0.020
0.000 | 0.028
0.000 | 0.051
0.000 | 0.000
0.130 | 0.227
0.000 | 0.000
0.000 | 0.000
| Plot | Mito | Lyso | Perox | ER | Golgi | PM | Cytosol | Nucleus | |||||
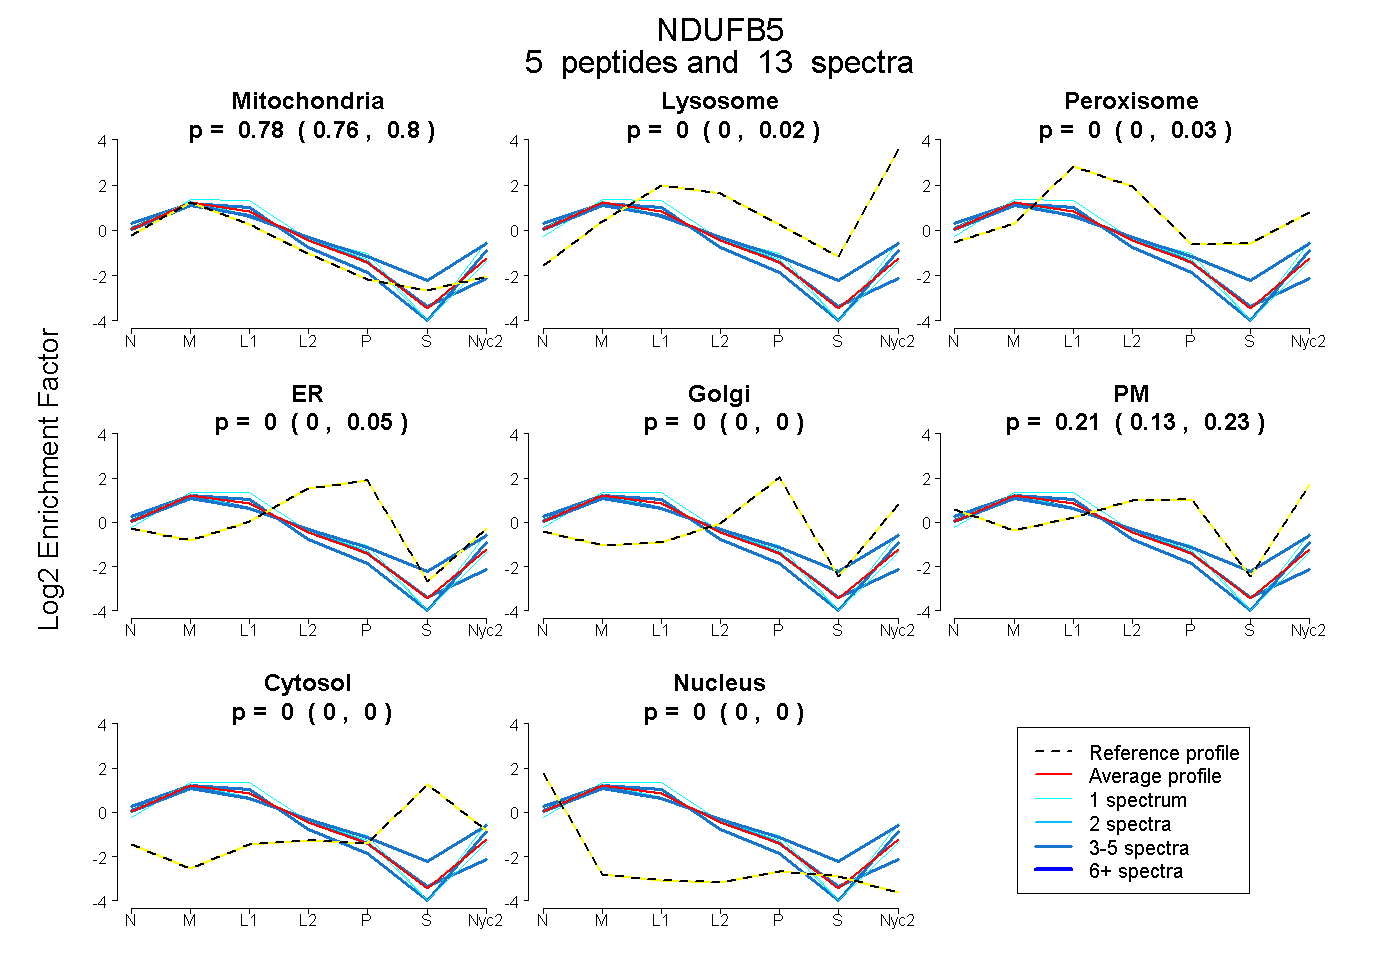
| Expt A |
5 peptides |
13 spectra |
|
0.785 0.758 | 0.803 |
0.000 0.000 | 0.020 |
0.004 0.000 | 0.028 |
0.000 0.000 | 0.051 |
0.000 0.000 | 0.000 |
0.211 0.130 | 0.227 |
0.000 0.000 | 0.000 |
0.000 0.000 | 0.000 |
| 5 spectra, EFIDYSPK | 0.844 | 0.000 | 0.000 | 0.156 | 0.000 | 0.000 | 0.000 | 0.000 | ||
| 3 spectra, TLAILQIESEK | 0.644 | 0.068 | 0.086 | 0.000 | 0.000 | 0.201 | 0.000 | 0.000 | ||
| 1 spectrum, TFYDGPEK | 0.780 | 0.000 | 0.000 | 0.093 | 0.000 | 0.127 | 0.000 | 0.000 | ||
| 1 spectrum, GDGPWYQYPTPEK | 0.689 | 0.116 | 0.000 | 0.000 | 0.000 | 0.195 | 0.000 | 0.000 | ||
| 3 spectra, LFVIKPSLYYDAR | 0.809 | 0.000 | 0.000 | 0.000 | 0.000 | 0.191 | 0.000 | 0.000 |
| Plot | Mito | Lyso or Perox | ER | Golgi | PM | Cytosol | Nucleus | ||||||
| Expt B |
4 peptides |
8 spectra |
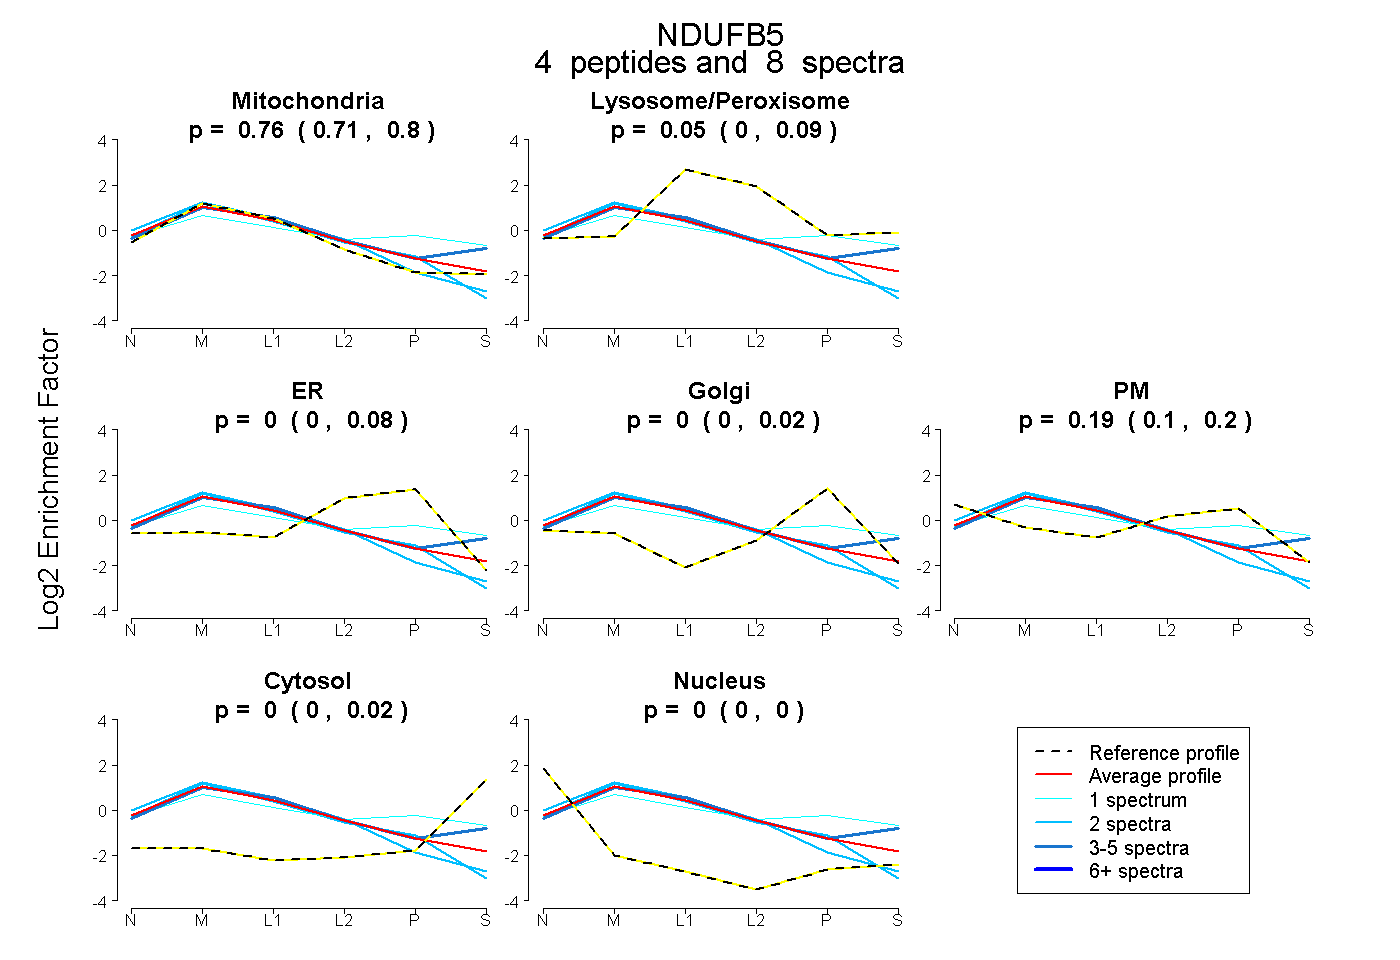 |
0.760 0.711 | 0.802 |
0.052 0.000 | 0.092 |
0.000 0.000 | 0.078 |
0.000 0.000 | 0.018 |
0.188 0.103 | 0.199 |
0.000 0.000 | 0.015 |
0.000 0.000 | 0.000 |
|||
| Plot | Lyso | Other | |||||||||||
| Expt C |
5 peptides |
55 spectra |
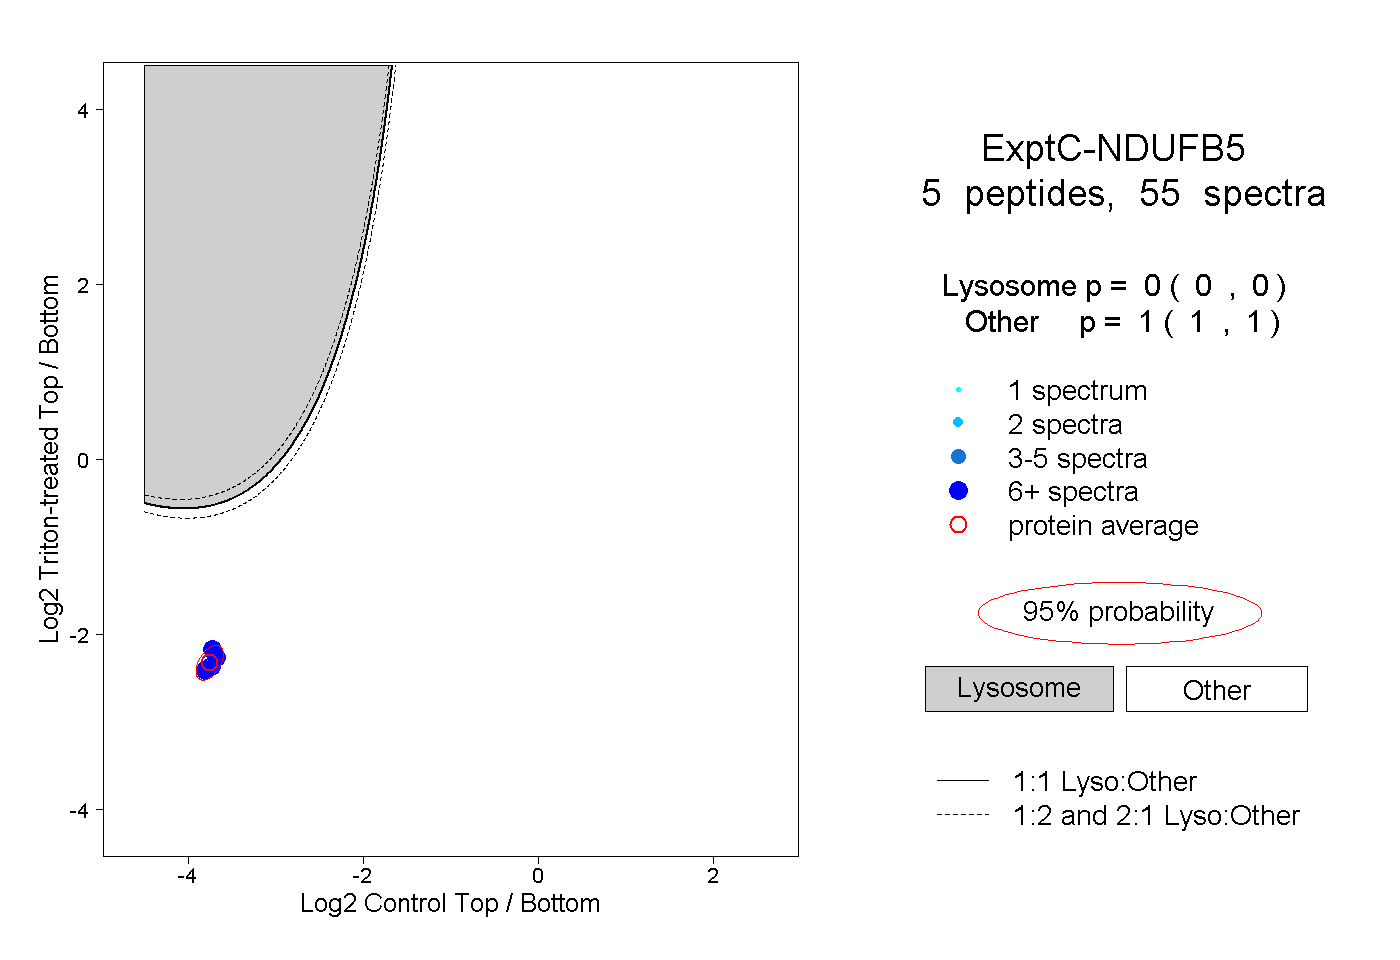 |
0.000 0.000 | 0.000 |
1.000 1.000 | 1.000 |
||||||||
| Plot | Lyso | Other | |||||||||||
| Expt D |
1 peptide |
1 spectrum |
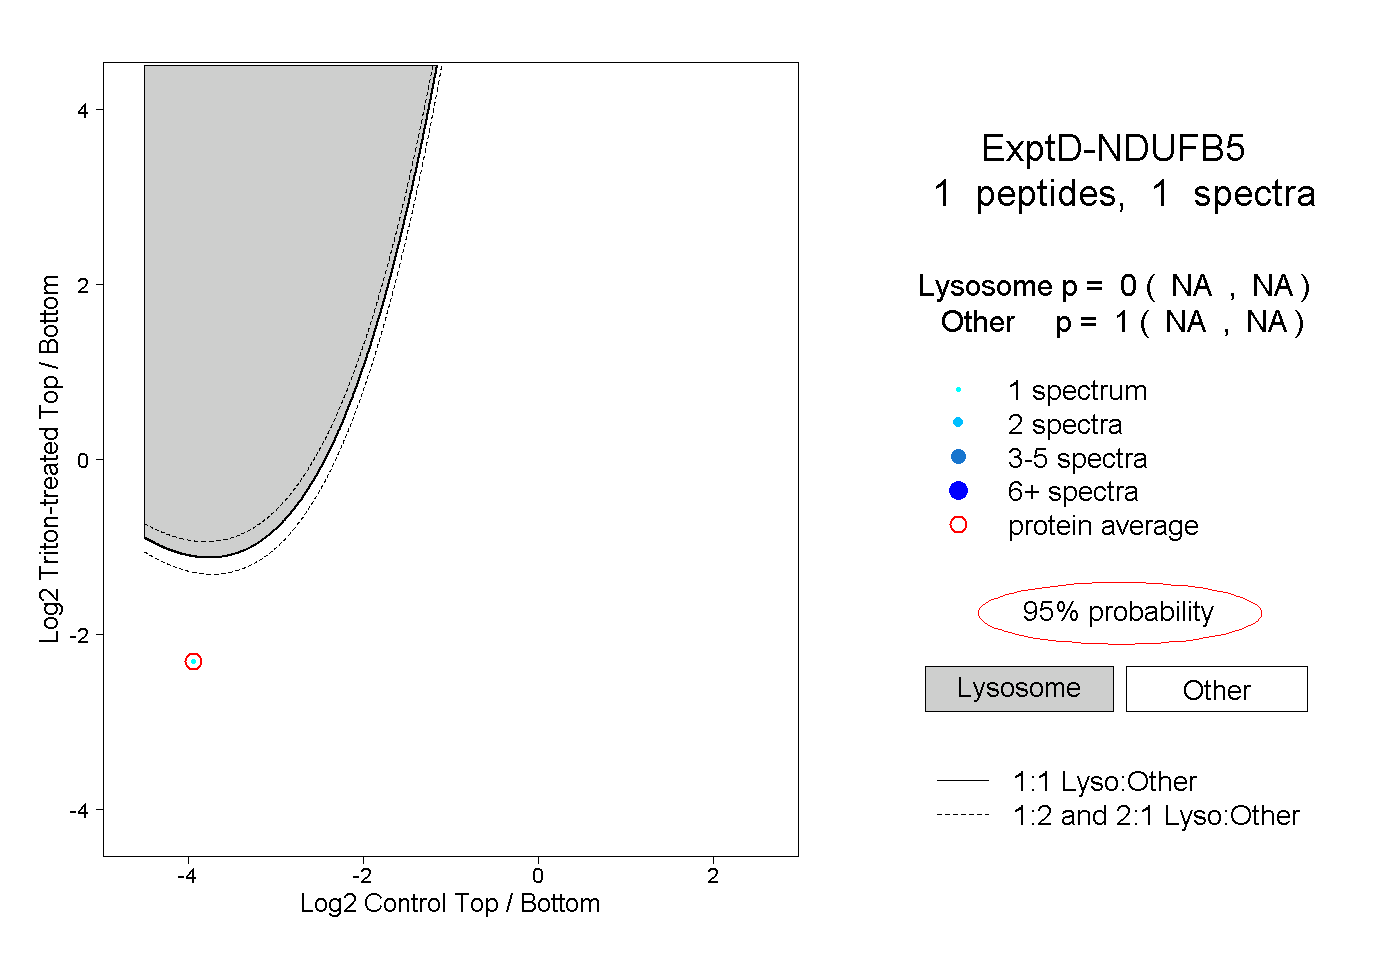 |
0.000 NA | NA |
1.000 NA | NA |