 6
6peptides
spectra
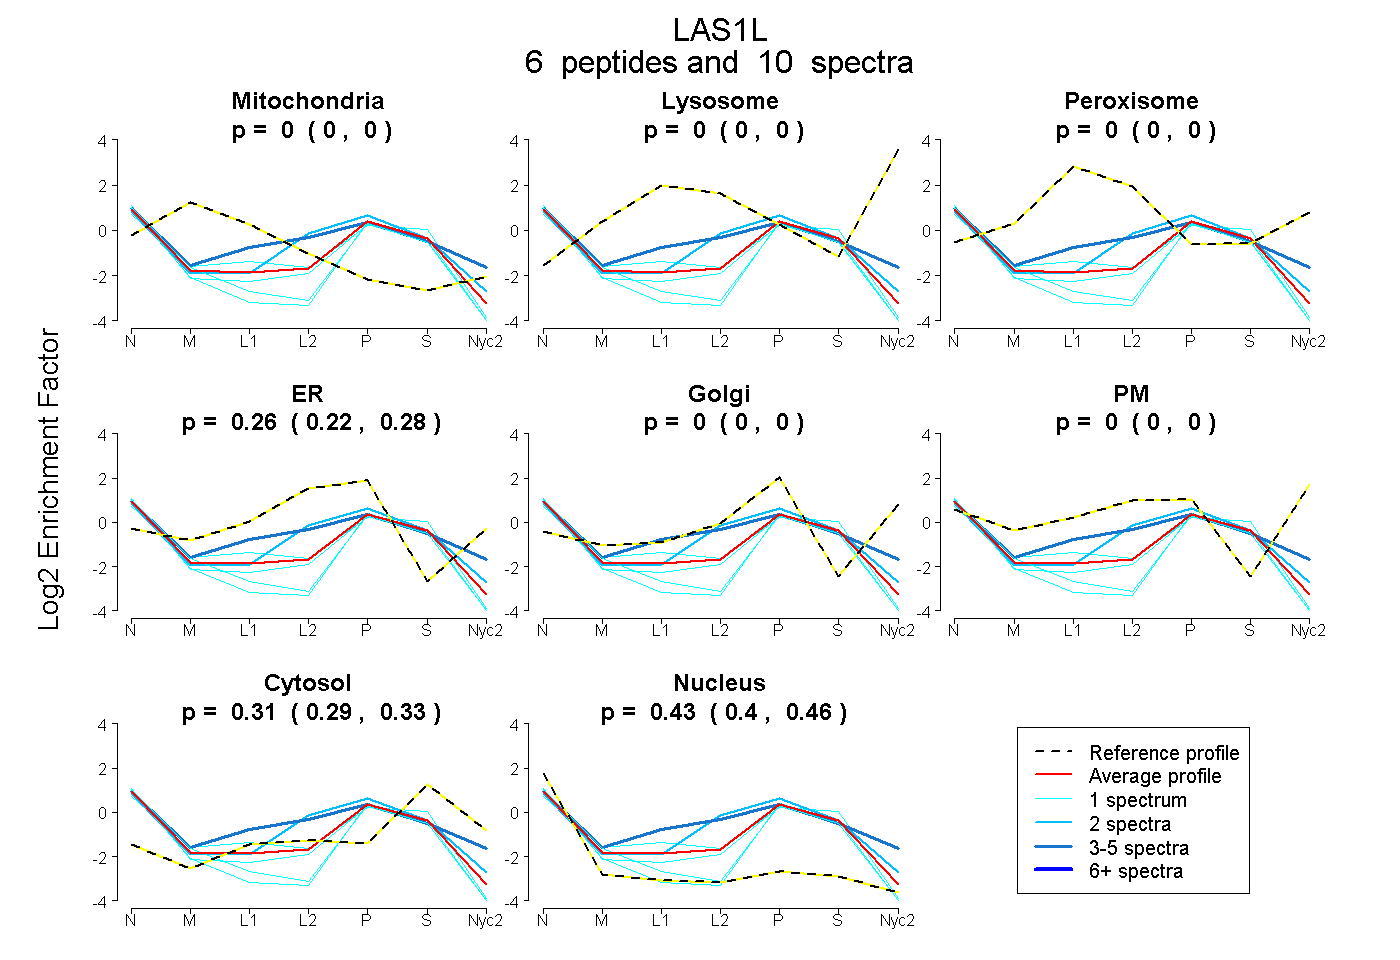
0.000 | 0.000
0.000 | 0.000
0.000 | 0.000
0.223 | 0.281
0.000 | 0.000
0.000 | 0.000
0.294 | 0.328
0.401 | 0.456
| Plot | Mito | Lyso | Perox | ER | Golgi | PM | Cytosol | Nucleus | |||||
| Expt A |
6 peptides |
10 spectra |
|
0.000 0.000 | 0.000 |
0.000 0.000 | 0.000 |
0.000 0.000 | 0.000 |
0.257 0.223 | 0.281 |
0.000 0.000 | 0.000 |
0.000 0.000 | 0.000 |
0.313 0.294 | 0.328 |
0.430 0.401 | 0.456 |
| 1 spectrum, VQGILEELK | 0.000 | 0.000 | 0.000 | 0.000 | 0.133 | 0.000 | 0.254 | 0.612 | ||
| 4 spectra, TGIRPTYILR | 0.000 | 0.000 | 0.074 | 0.403 | 0.000 | 0.000 | 0.287 | 0.235 | ||
| 1 spectrum, ELLVSYEEEQFK | 0.000 | 0.000 | 0.000 | 0.194 | 0.000 | 0.000 | 0.265 | 0.542 | ||
| 1 spectrum, WGIFPIGR | 0.000 | 0.000 | 0.000 | 0.000 | 0.085 | 0.000 | 0.287 | 0.628 | ||
| 1 spectrum, GCYFVLHWLQK | 0.006 | 0.000 | 0.000 | 0.221 | 0.000 | 0.000 | 0.373 | 0.400 | ||
| 2 spectra, HLLQAIK | 0.000 | 0.000 | 0.000 | 0.400 | 0.000 | 0.000 | 0.303 | 0.297 |
| Plot | Mito | Lyso or Perox | ER | Golgi | PM | Cytosol | Nucleus | ||||||
| Expt B |
1 peptide |
2 spectra |
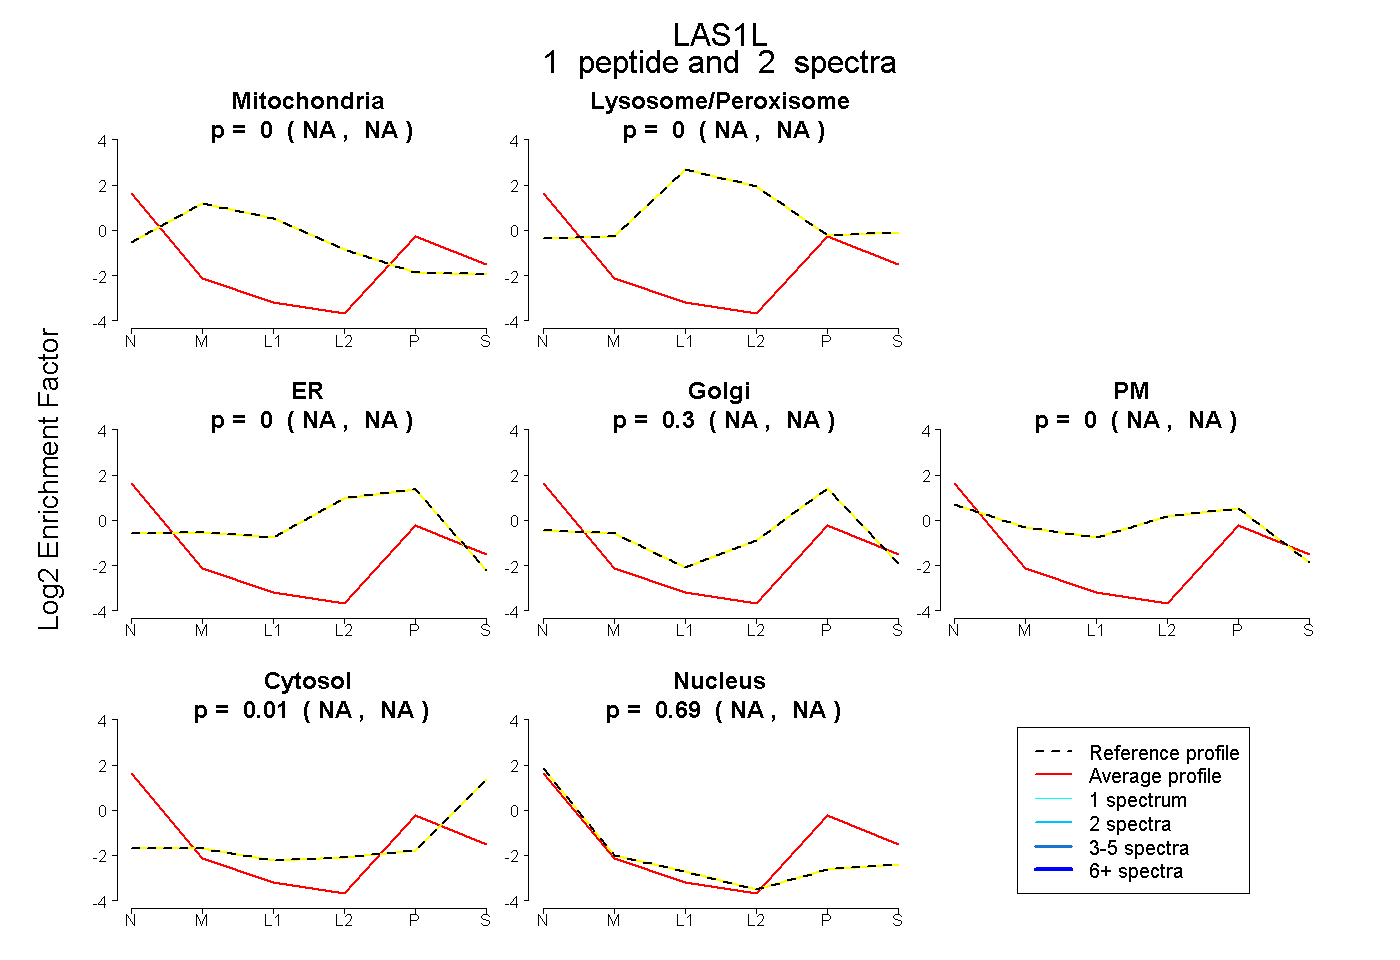 |
0.000 NA | NA |
0.000 NA | NA |
0.000 NA | NA |
0.303 NA | NA |
0.000 NA | NA |
0.007 NA | NA |
0.690 NA | NA |