 8
8peptides
spectra
0.000 | 0.000
0.729 | 0.791
0.000 | 0.000
0.000 | 0.000
0.092 | 0.187
0.022 | 0.147
0.000 | 0.012
0.000 | 0.000
12peptides
spectra
1.000 | 1.000
0.000 | 0.000
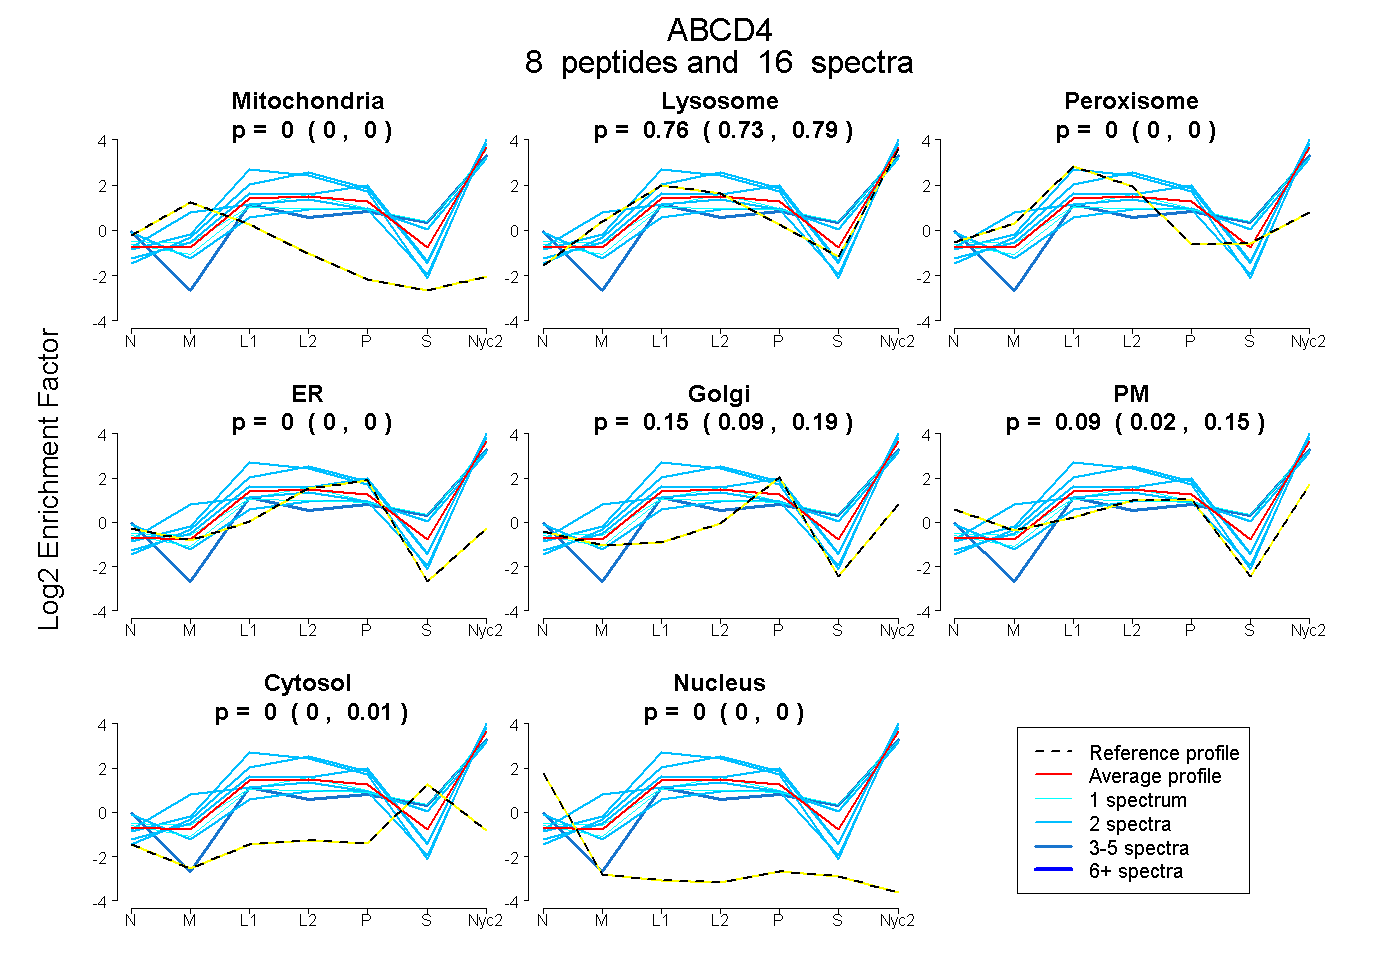
| Plot | Mito | Lyso | Perox | ER | Golgi | PM | Cytosol | Nucleus | |||||
| Expt A |
8 peptides |
16 spectra |
|
0.000 0.000 | 0.000 |
0.764 0.729 | 0.791 |
0.000 0.000 | 0.000 |
0.000 0.000 | 0.000 |
0.147 0.092 | 0.187 |
0.089 0.022 | 0.147 |
0.000 0.000 | 0.012 |
0.000 0.000 | 0.000 |
||
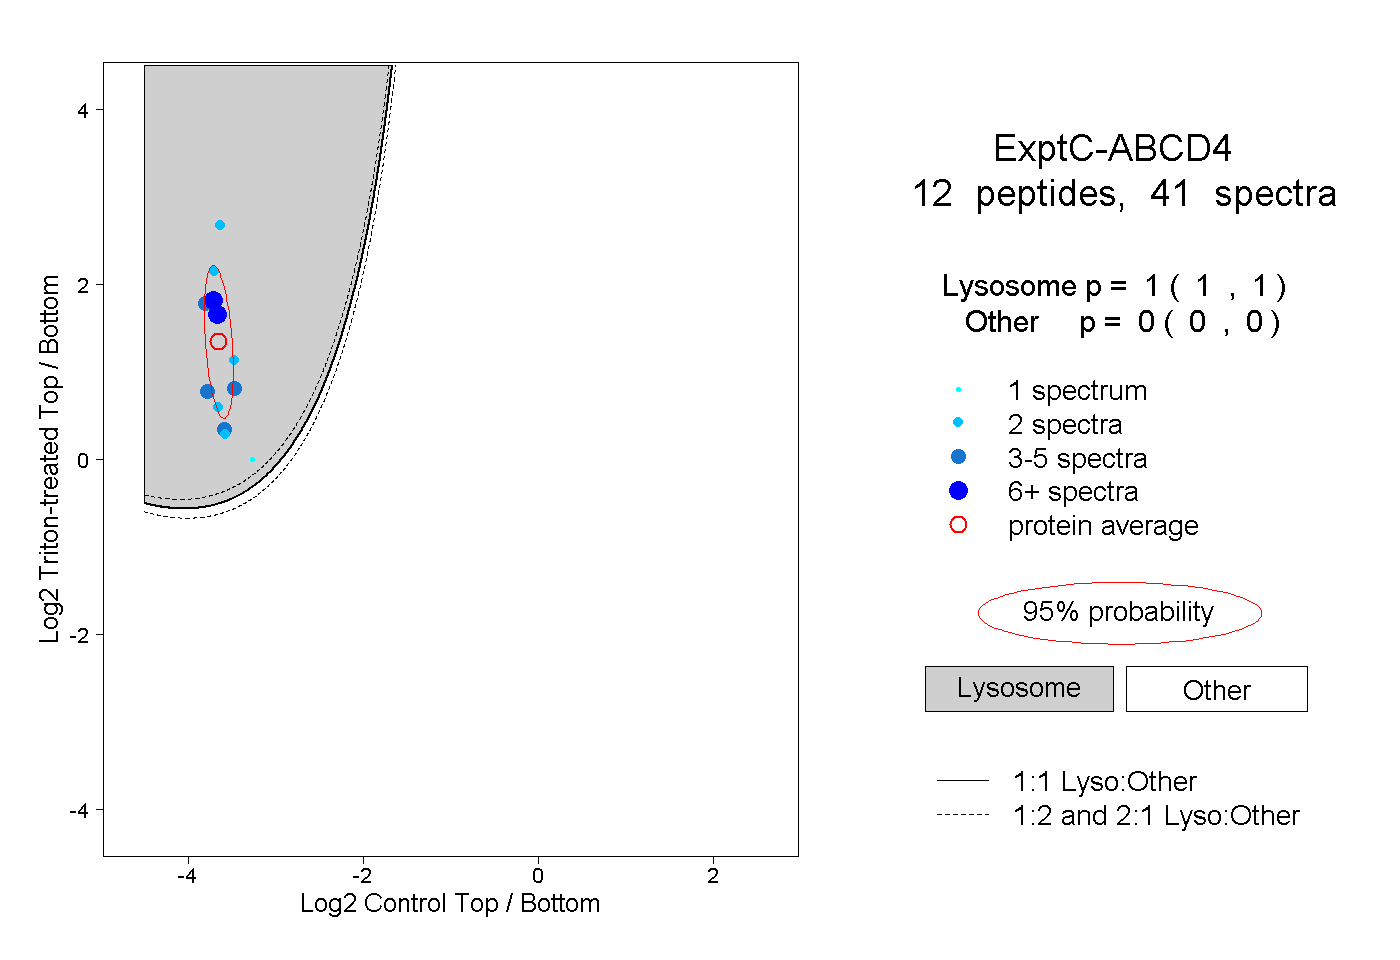
| Plot | Lyso | Other | |||||||||||
| Expt C |
12 peptides |
41 spectra |
|
1.000 1.000 | 1.000 |
0.000 0.000 | 0.000 |