 2
2peptides
spectra
0.000 | 0.058
0.000 | 0.098
0.000 | 0.126
0.000 | 0.171
0.000 | 0.002
0.706 | 0.979
0.000 | 0.054
0.000 | 0.020
1peptide
spectrum
NA | NA
NA | NA
NA | NA
NA | NA
NA | NA
NA | NA
NA | NA
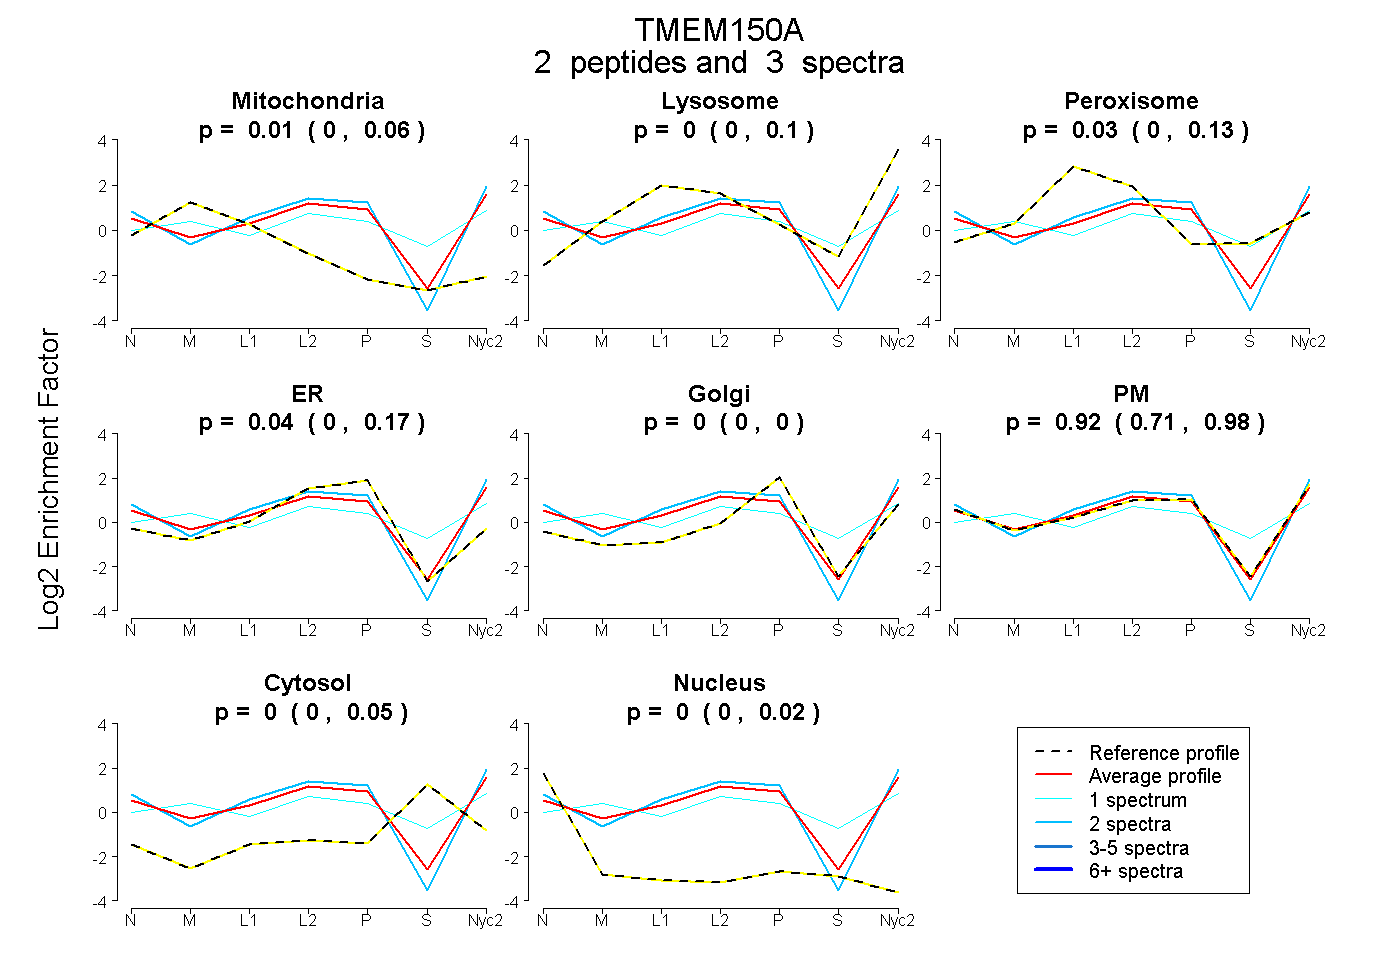
| Plot | Mito | Lyso | Perox | ER | Golgi | PM | Cytosol | Nucleus | |||||
| Expt A |
2 peptides |
3 spectra |
|
0.007 0.000 | 0.058 |
0.000 0.000 | 0.098 |
0.032 0.000 | 0.126 |
0.036 0.000 | 0.171 |
0.000 0.000 | 0.002 |
0.925 0.706 | 0.979 |
0.000 0.000 | 0.054 |
0.000 0.000 | 0.020 |
||
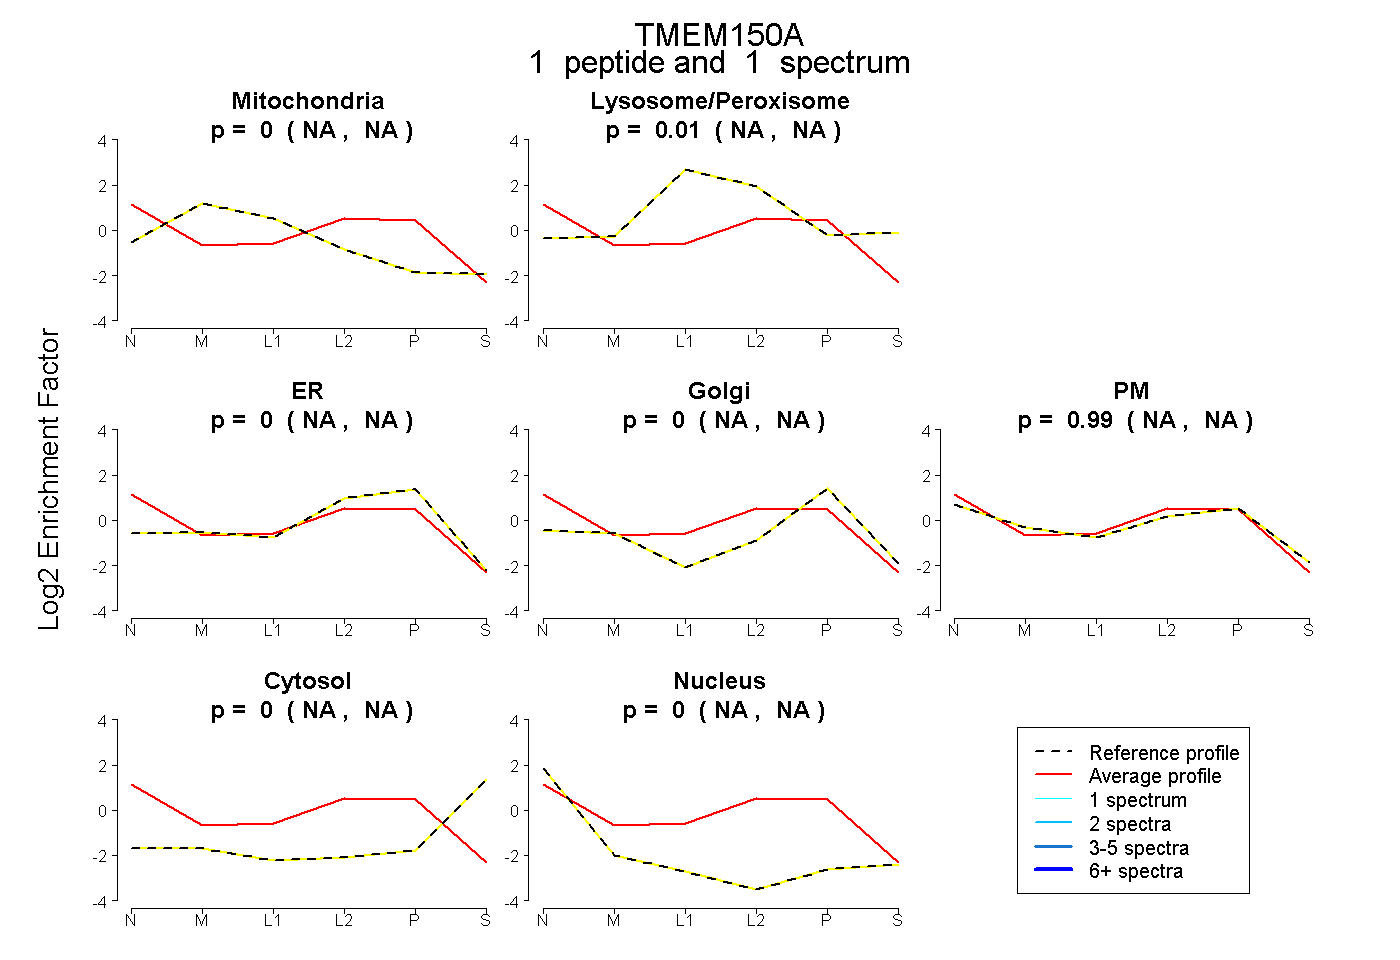
| Plot | Mito | Lyso or Perox | ER | Golgi | PM | Cytosol | Nucleus | ||||||
| Expt B |
1 peptide |
1 spectrum |
|
0.000 NA | NA |
0.012 NA | NA |
0.000 NA | NA |
0.000 NA | NA |
0.988 NA | NA |
0.000 NA | NA |
0.000 NA | NA |
| 1 spectrum, YGQLLEQNR | 0.000 | 0.012 | 0.000 | 0.000 | 0.988 | 0.000 | 0.000 |
| Plot | Lyso | Other | |||||||||||
| Expt C |
1 peptide |
2 spectra |
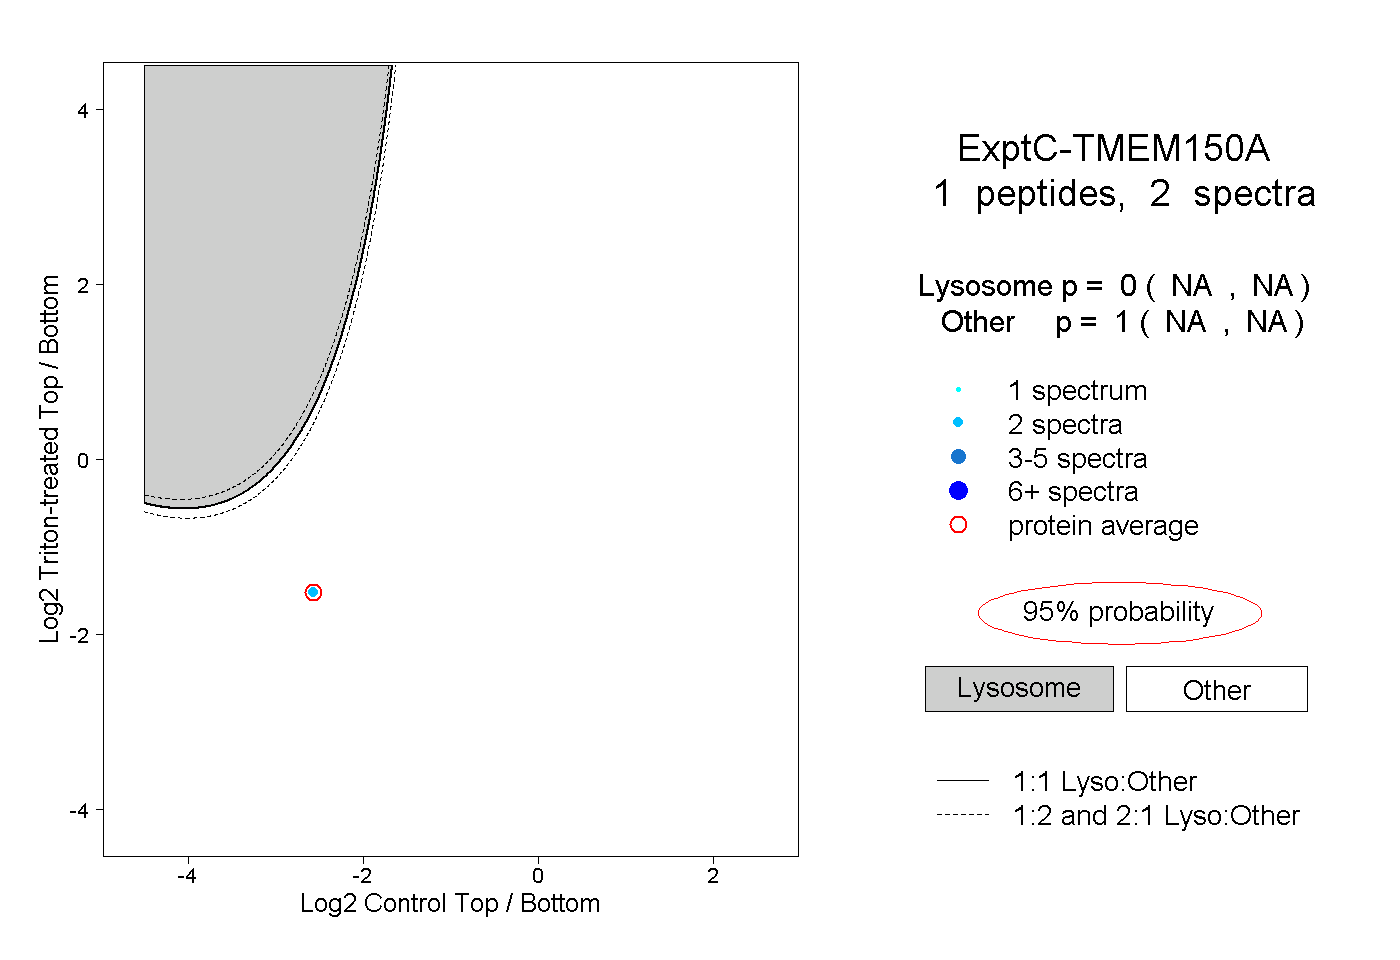 |
0.000 NA | NA |
1.000 NA | NA |
||||||||
| Plot | Lyso | Other | |||||||||||
| Expt D |
2 peptides |
3 spectra |
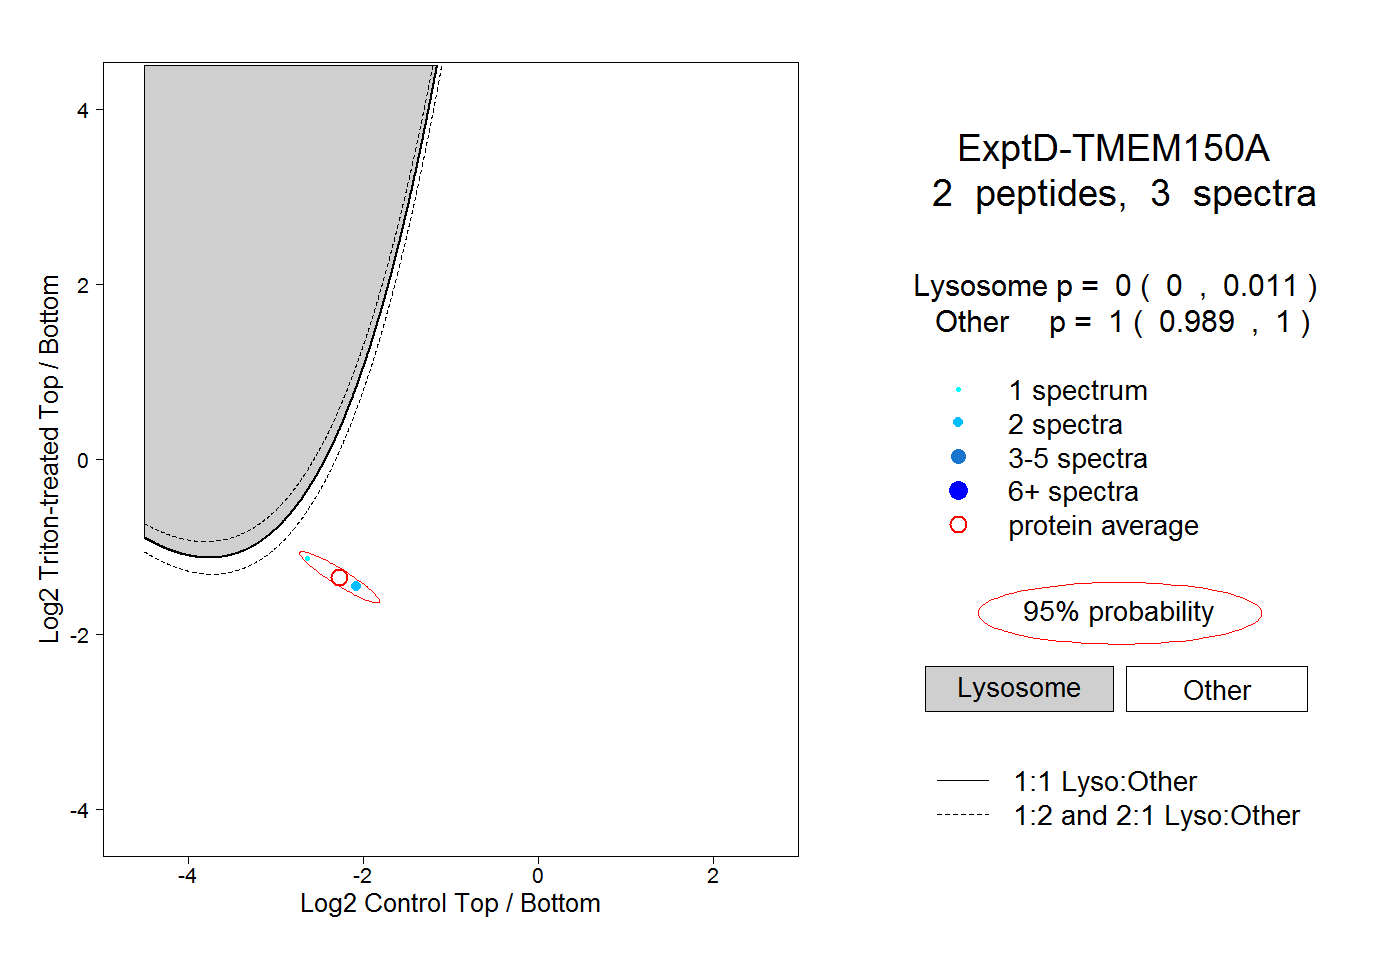 |
0.000 0.000 | 0.011 |
1.000 0.989 | 1.000 |