19
19peptides
spectra

0.000 | 0.000
0.000 | 0.000
0.000 | 0.000
0.000 | 0.000
0.099 | 0.113
0.066 | 0.082
0.756 | 0.761
0.057 | 0.062
9peptides
spectra
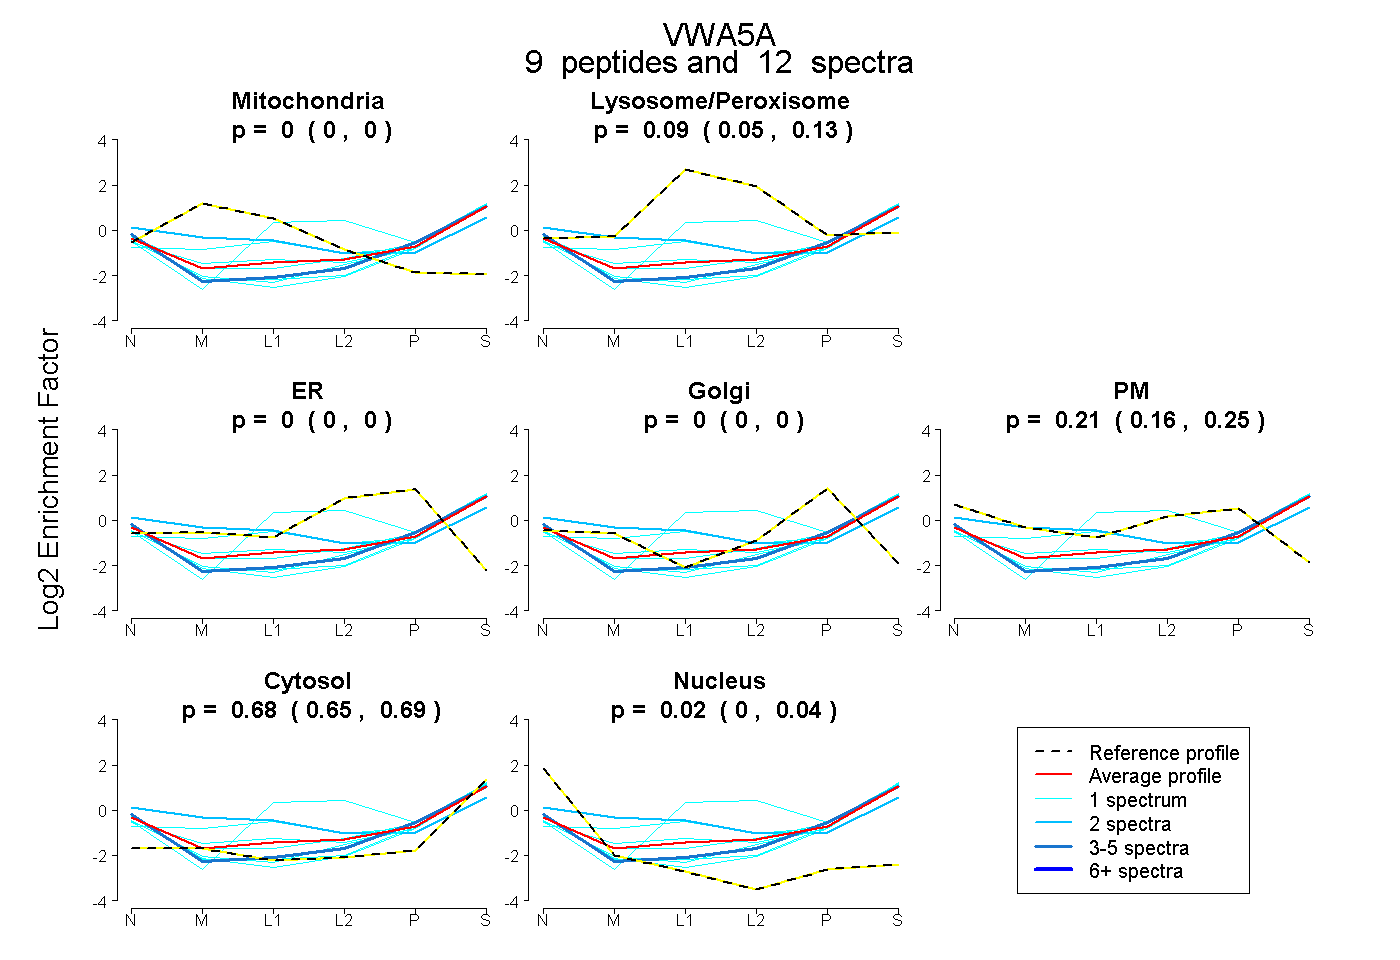
0.000 | 0.000
0.052 | 0.132
0.000 | 0.000
0.000 | 0.000
0.161 | 0.250
0.653 | 0.693
0.000 | 0.039