14
14peptides
spectra
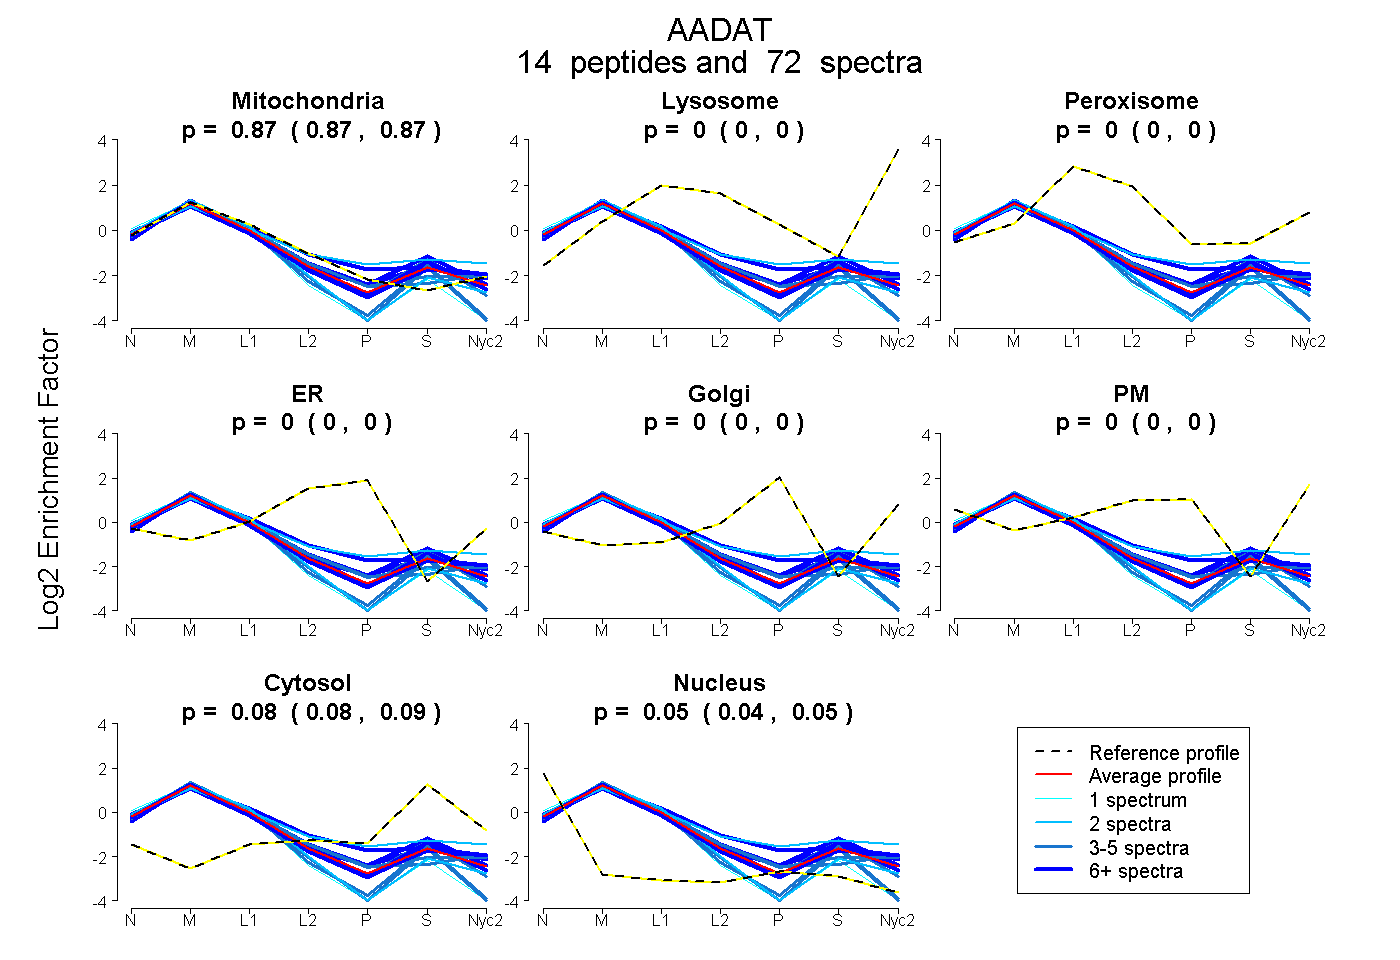
0.868 | 0.872
0.000 | 0.000
0.000 | 0.000
0.000 | 0.000
0.000 | 0.000
0.000 | 0.000
0.080 | 0.088
0.042 | 0.048
13peptides
spectra
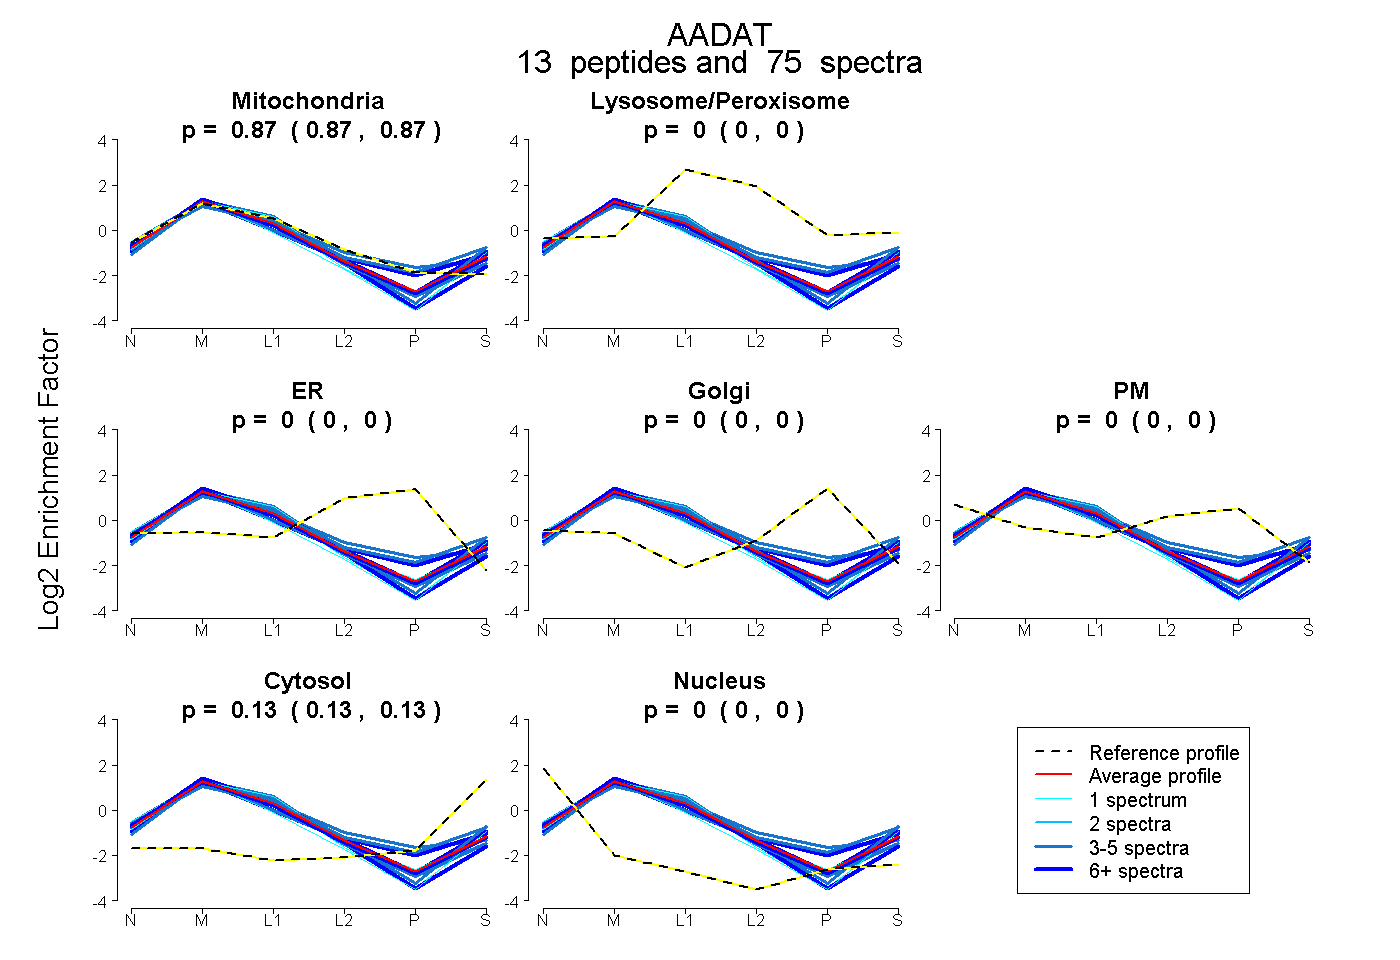
0.869 | 0.874
0.000 | 0.000
0.000 | 0.000
0.000 | 0.000
0.000 | 0.000
0.126 | 0.131
0.000 | 0.000