 14
14peptides
spectra
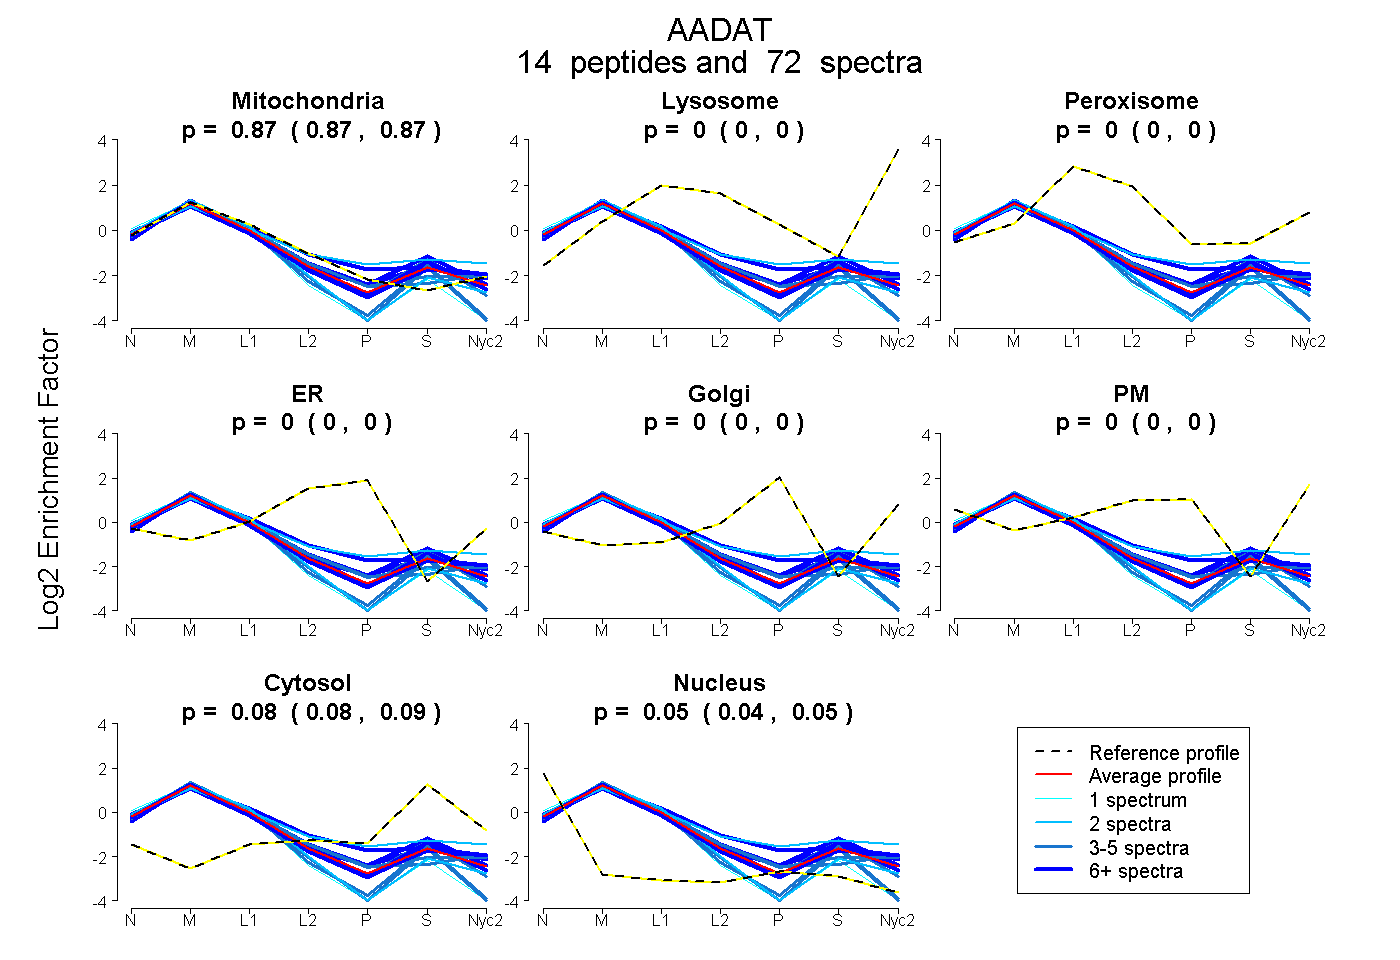
0.868 | 0.872
0.000 | 0.000
0.000 | 0.000
0.000 | 0.000
0.000 | 0.000
0.000 | 0.000
0.080 | 0.088
0.042 | 0.048
| Plot | Mito | Lyso | Perox | ER | Golgi | PM | Cytosol | Nucleus | |||||
| Expt A |
14 peptides |
72 spectra |
|
0.870 0.868 | 0.872 |
0.000 0.000 | 0.000 |
0.000 0.000 | 0.000 |
0.000 0.000 | 0.000 |
0.000 0.000 | 0.000 |
0.000 0.000 | 0.000 |
0.084 0.080 | 0.088 |
0.045 0.042 | 0.048 |
| 2 spectra, SAVFTVENGSTIR | 0.721 | 0.001 | 0.072 | 0.000 | 0.000 | 0.030 | 0.175 | 0.000 | ||
| 3 spectra, DIISLAPGSPNPK | 0.821 | 0.000 | 0.000 | 0.000 | 0.000 | 0.000 | 0.000 | 0.179 | ||
| 6 spectra, DFILAAADK | 0.837 | 0.000 | 0.000 | 0.000 | 0.000 | 0.000 | 0.102 | 0.061 | ||
| 3 spectra, FLTATSLAR | 0.956 | 0.000 | 0.000 | 0.000 | 0.000 | 0.000 | 0.029 | 0.014 | ||
| 11 spectra, AGMFLWIK | 0.871 | 0.000 | 0.000 | 0.000 | 0.000 | 0.000 | 0.129 | 0.000 | ||
| 8 spectra, VISSGLR | 0.870 | 0.000 | 0.000 | 0.000 | 0.000 | 0.000 | 0.098 | 0.032 | ||
| 3 spectra, GLAEWHVPK | 0.816 | 0.000 | 0.000 | 0.000 | 0.000 | 0.000 | 0.000 | 0.184 | ||
| 3 spectra, LAQLLK | 0.899 | 0.000 | 0.000 | 0.000 | 0.000 | 0.000 | 0.064 | 0.037 | ||
| 3 spectra, AIDFYK | 0.834 | 0.000 | 0.000 | 0.000 | 0.000 | 0.000 | 0.096 | 0.070 | ||
| 2 spectra, VGFITGPK | 0.891 | 0.000 | 0.000 | 0.000 | 0.000 | 0.000 | 0.000 | 0.109 | ||
| 1 spectrum, ASFSQVTPAQMDLVFQR | 0.788 | 0.000 | 0.000 | 0.000 | 0.000 | 0.000 | 0.000 | 0.212 | ||
| 9 spectra, FEGEMFQR | 0.873 | 0.000 | 0.000 | 0.000 | 0.000 | 0.000 | 0.105 | 0.021 | ||
| 10 spectra, EIYELAR | 0.803 | 0.000 | 0.000 | 0.000 | 0.000 | 0.000 | 0.169 | 0.028 | ||
| 8 spectra, ATVEIMSR | 0.834 | 0.000 | 0.044 | 0.000 | 0.000 | 0.000 | 0.123 | 0.000 |
| Plot | Mito | Lyso or Perox | ER | Golgi | PM | Cytosol | Nucleus | ||||||
| Expt B |
13 peptides |
75 spectra |
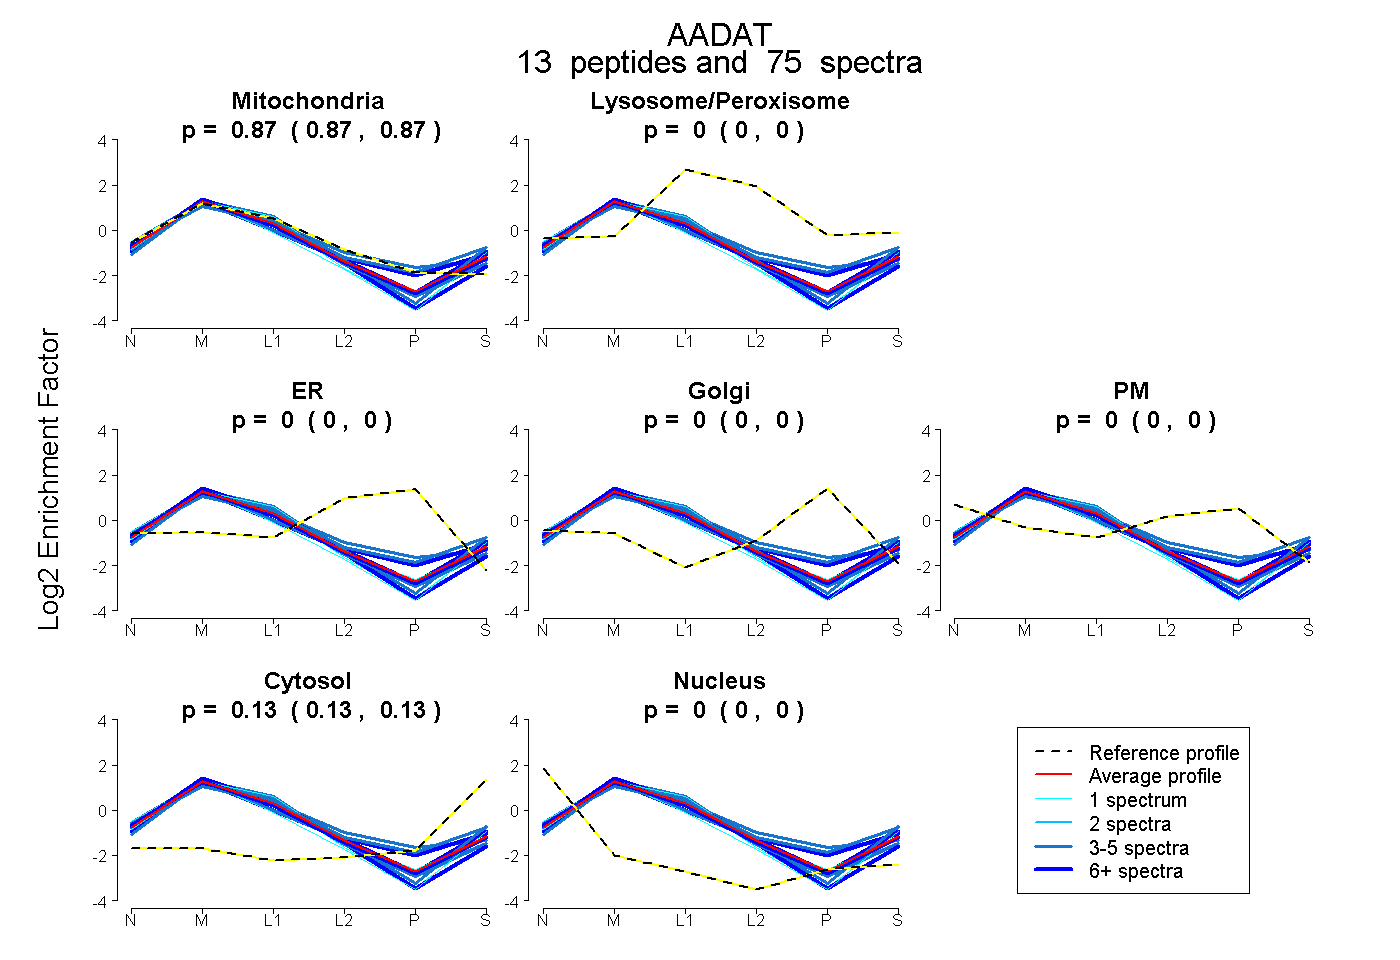 |
0.872 0.869 | 0.874 |
0.000 0.000 | 0.000 |
0.000 0.000 | 0.000 |
0.000 0.000 | 0.000 |
0.000 0.000 | 0.000 |
0.128 0.126 | 0.131 |
0.000 0.000 | 0.000 |
|||
| Plot | Lyso | Other | |||||||||||
| Expt C |
17 peptides |
489 spectra |
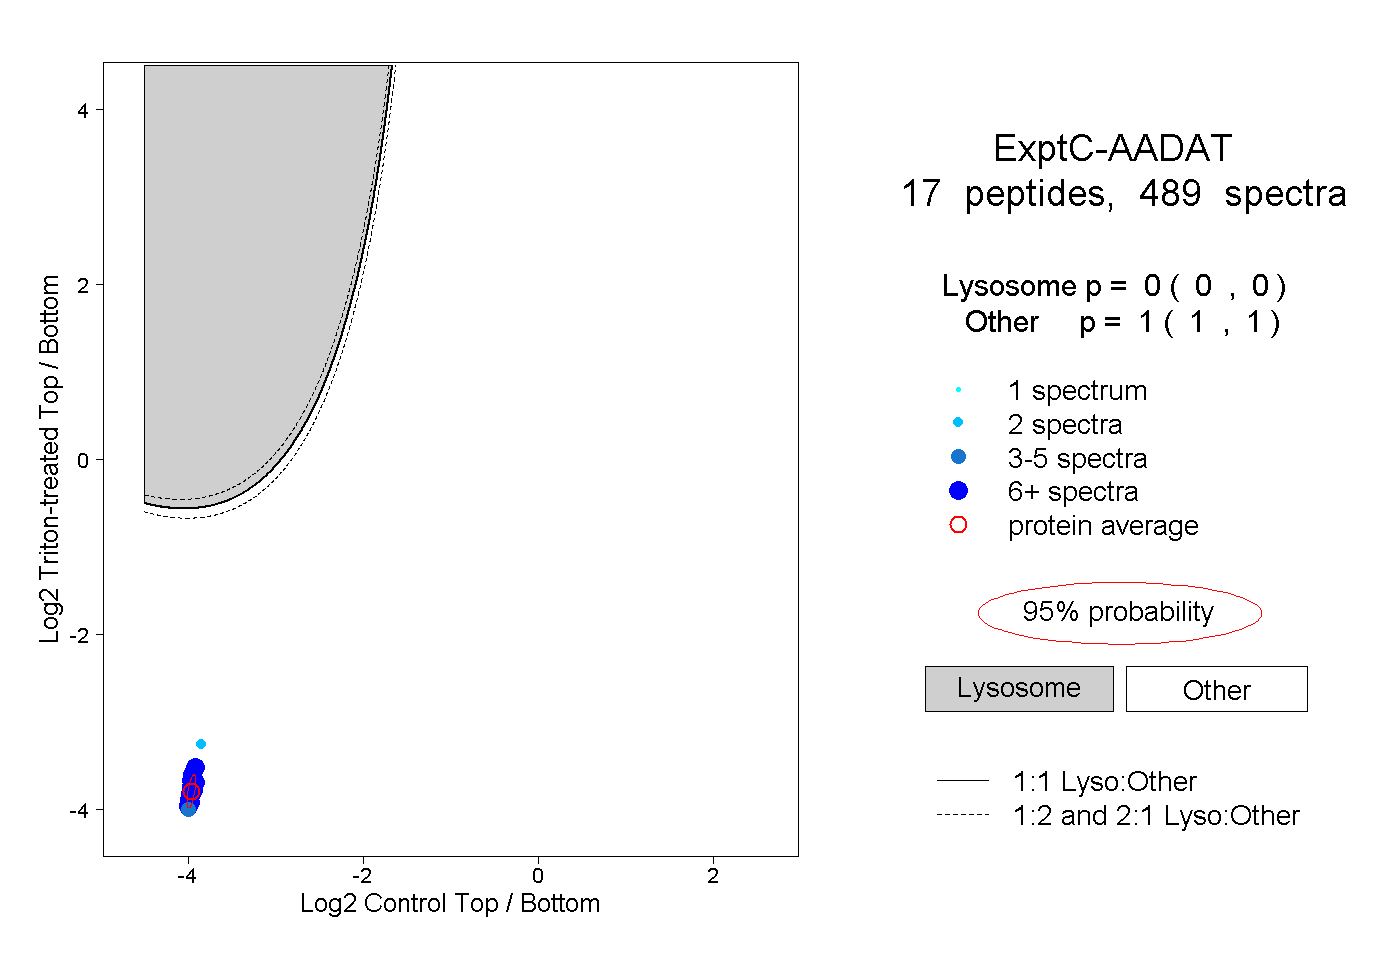 |
0.000 0.000 | 0.000 |
1.000 1.000 | 1.000 |
||||||||
| Plot | Lyso | Other | |||||||||||
| Expt D |
11 peptides |
22 spectra |
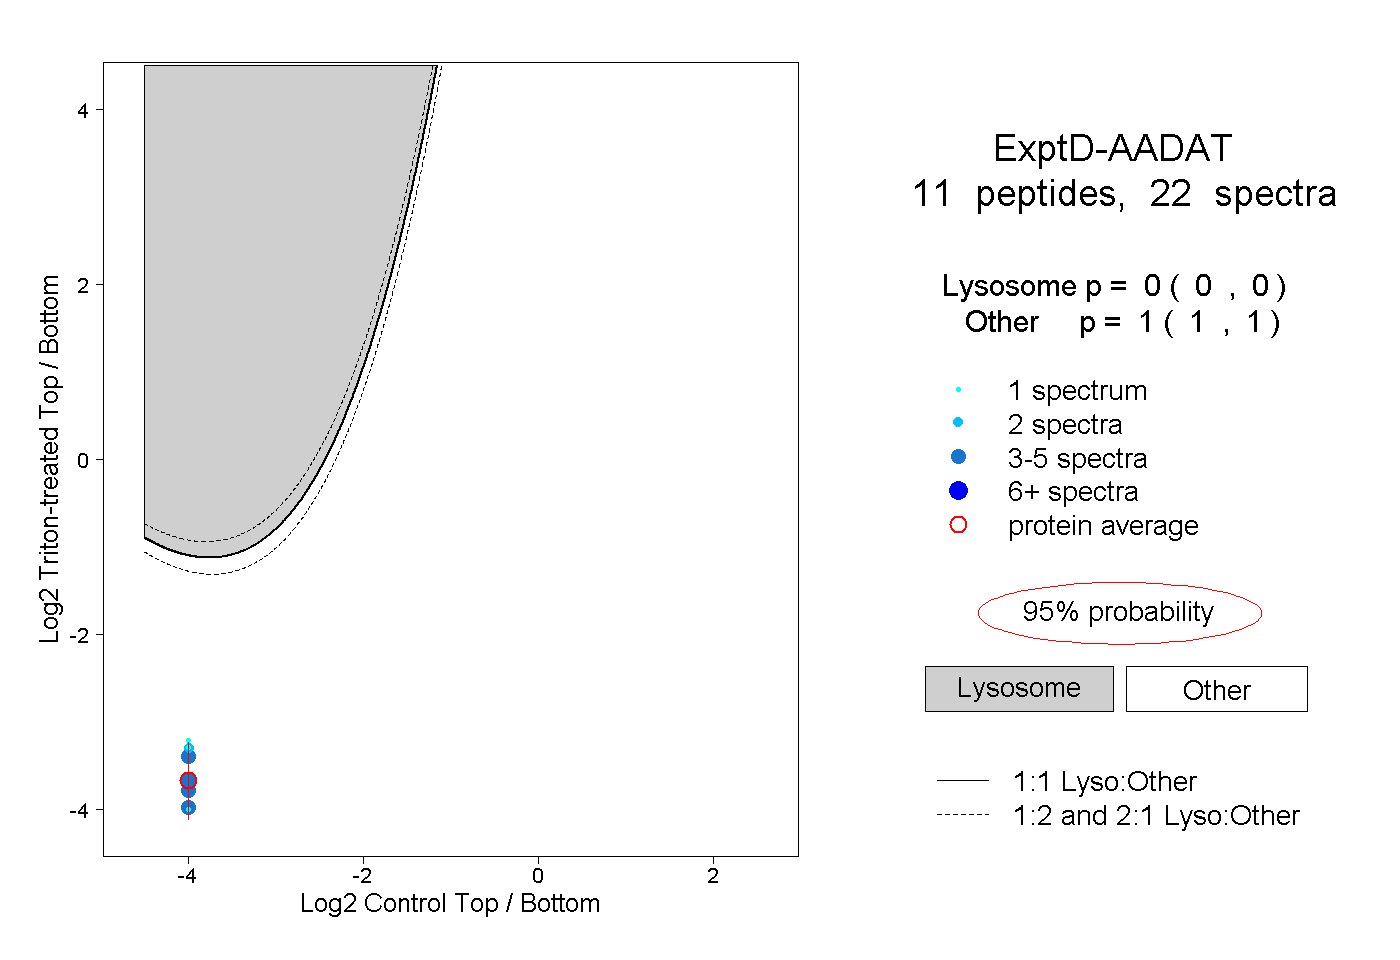 |
0.000 0.000 | 0.000 |
1.000 1.000 | 1.000 |