 13
13peptides
spectra

0.000 | 0.000
0.000 | 0.000
0.000 | 0.000
0.347 | 0.365
0.000 | 0.000
0.000 | 0.000
0.294 | 0.311
0.331 | 0.347
2peptides
spectra
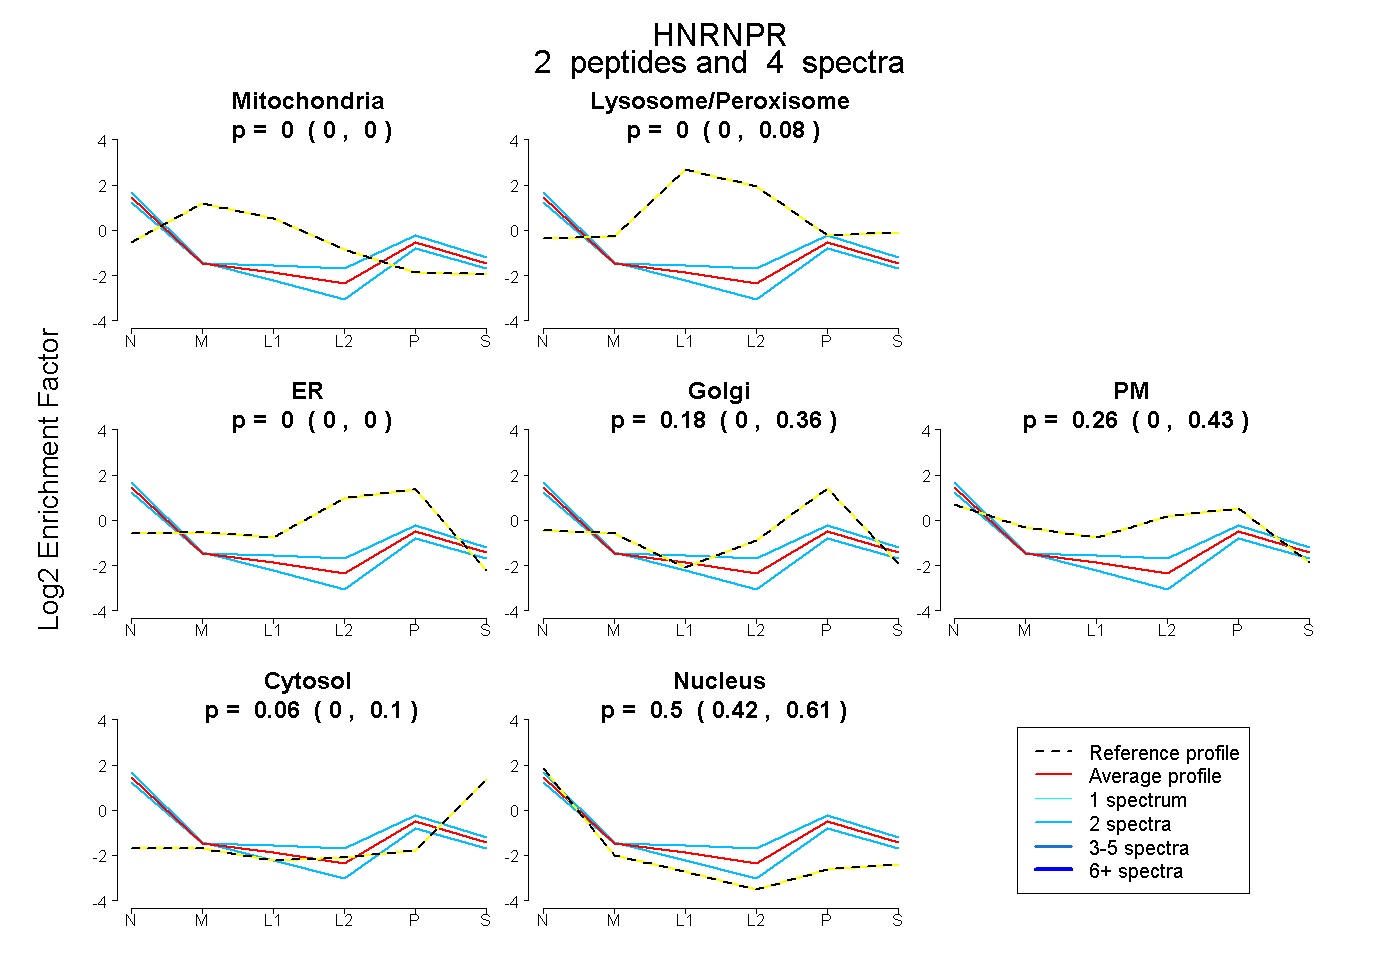
0.000 | 0.000
0.000 | 0.084
0.000 | 0.000
0.002 | 0.358
0.000 | 0.432
0.000 | 0.101
0.417 | 0.610
4peptides
spectra
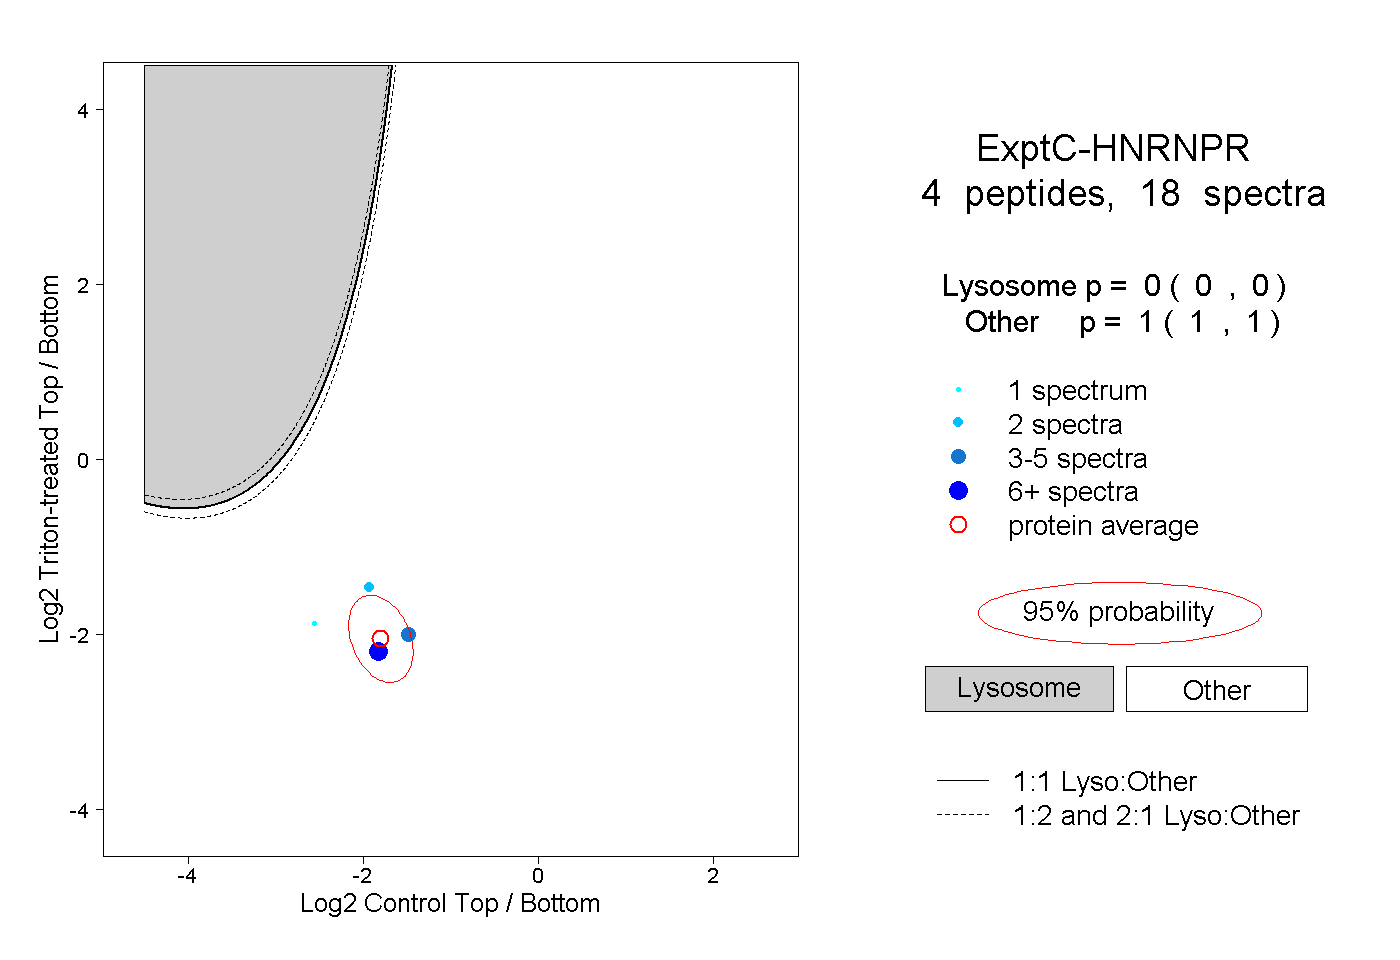
0.000 | 0.000
1.000 | 1.000