 16
16peptides
spectra
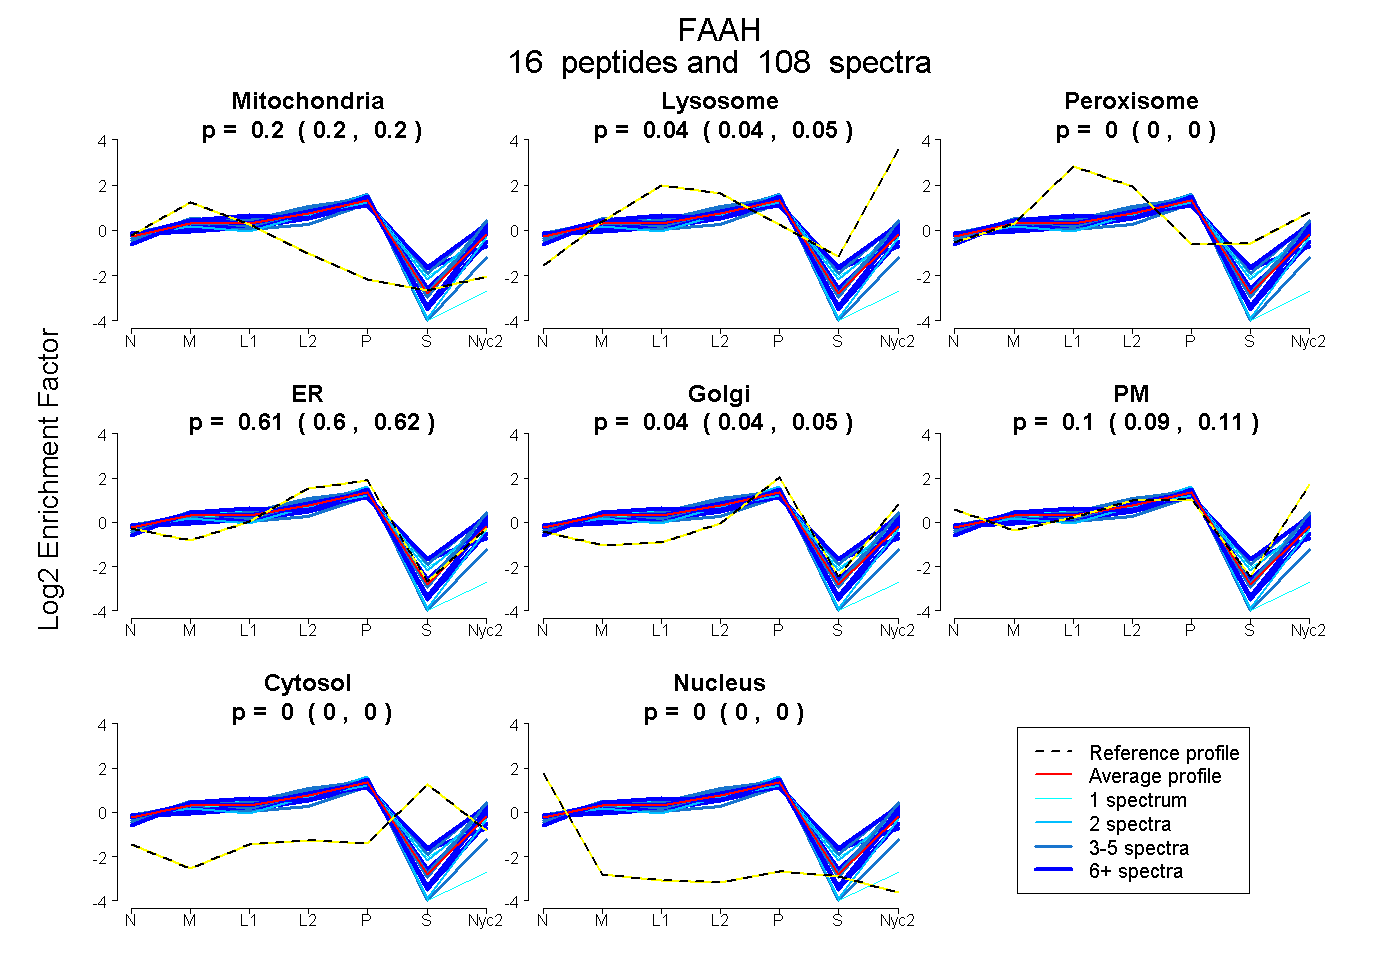
0.199 | 0.204
0.037 | 0.046
0.000 | 0.000
0.600 | 0.617
0.036 | 0.047
0.095 | 0.113
0.000 | 0.000
0.000 | 0.000
12peptides
spectra
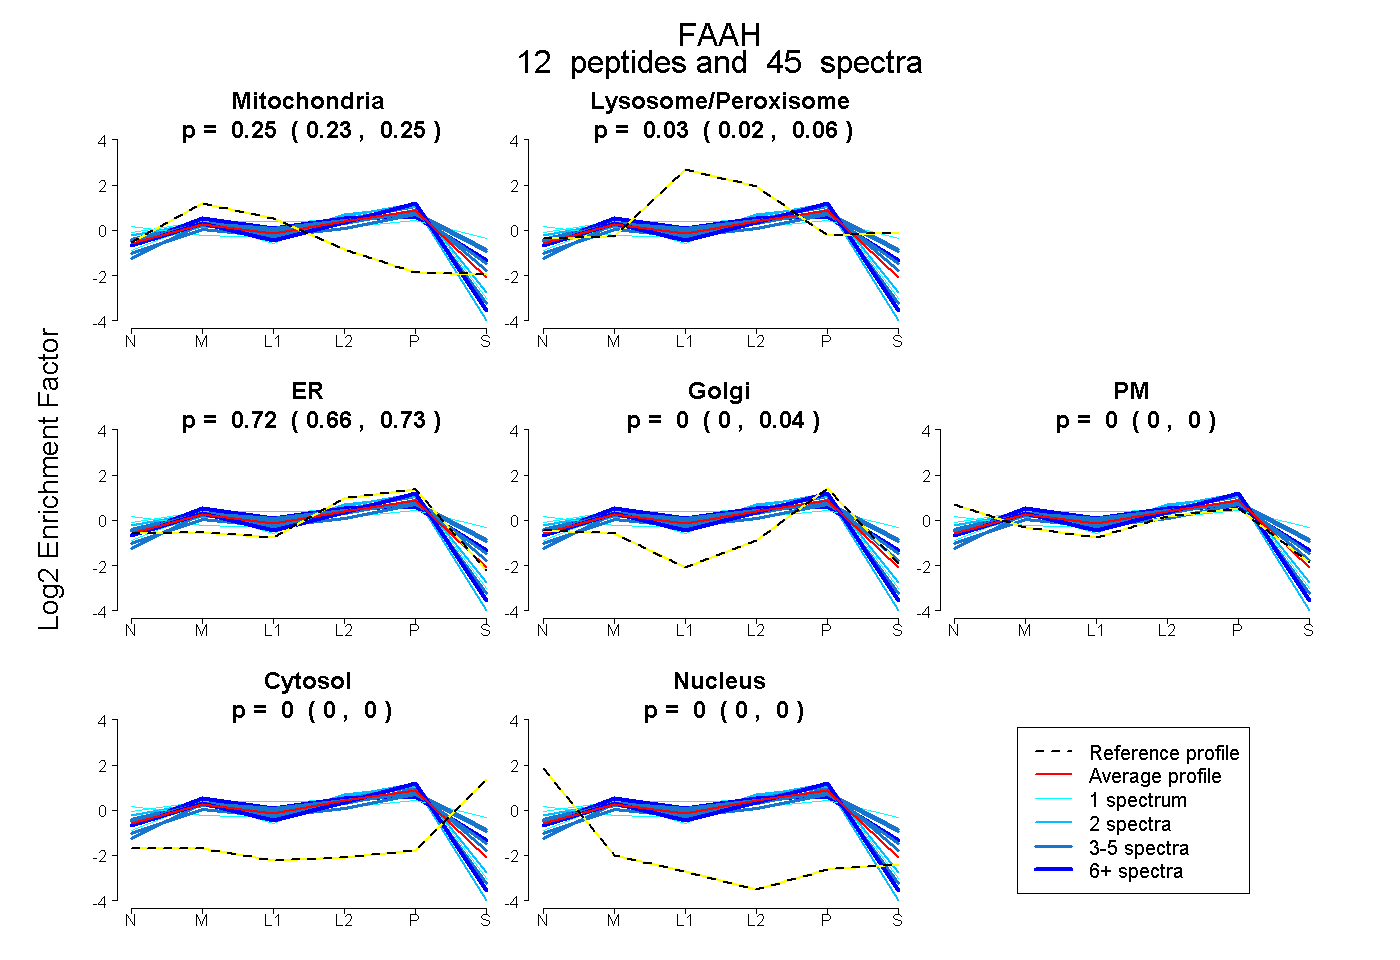
0.227 | 0.252
0.017 | 0.061
0.660 | 0.730
0.000 | 0.043
0.000 | 0.000
0.000 | 0.000
0.000 | 0.000
18peptides
spectra
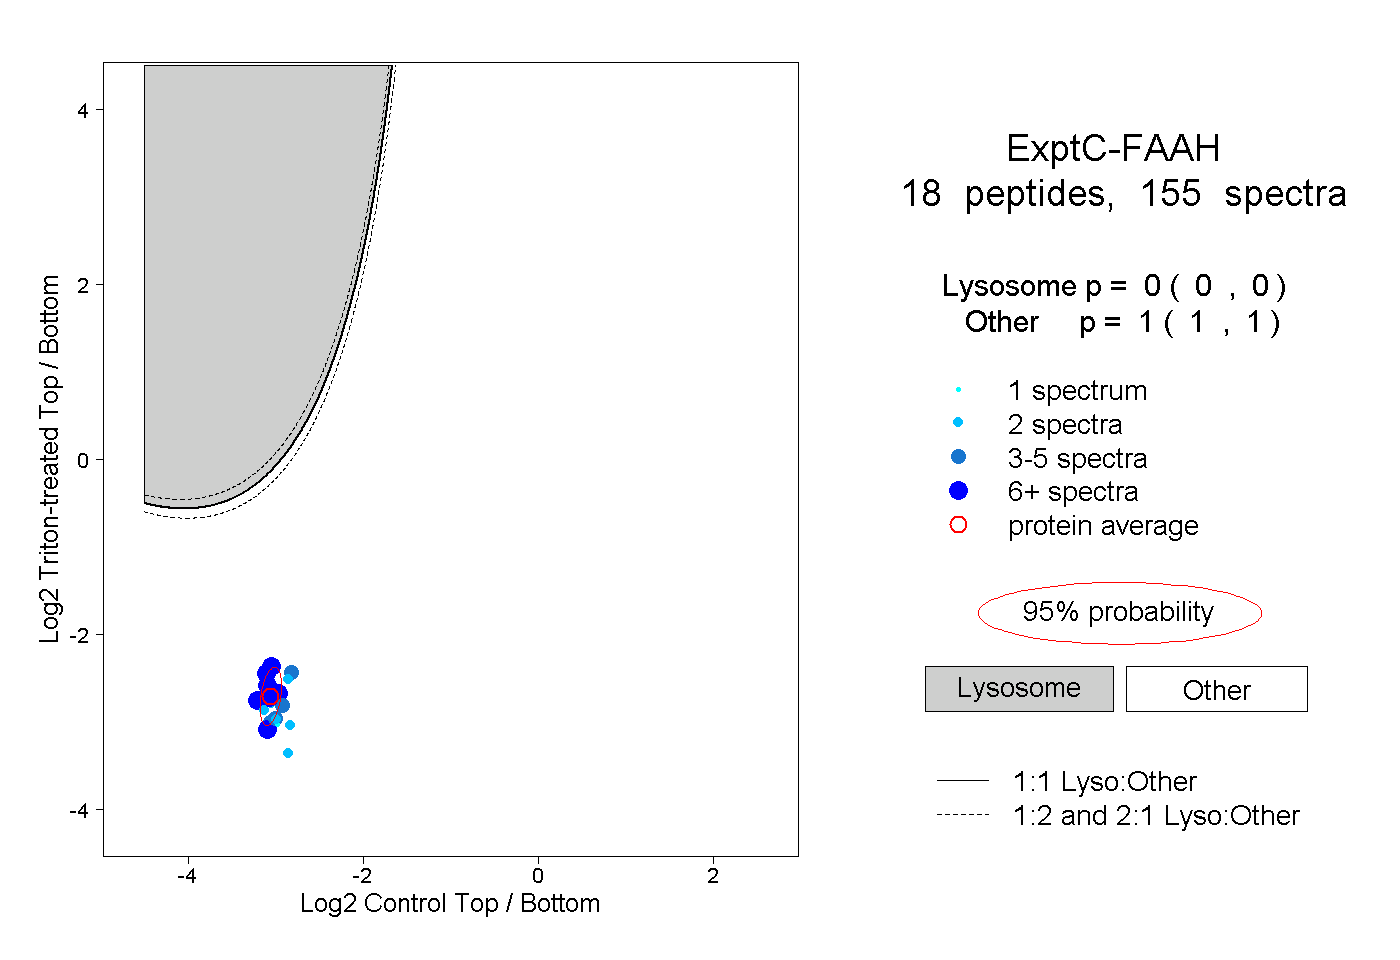
0.000 | 0.000
1.000 | 1.000
8peptides
spectra
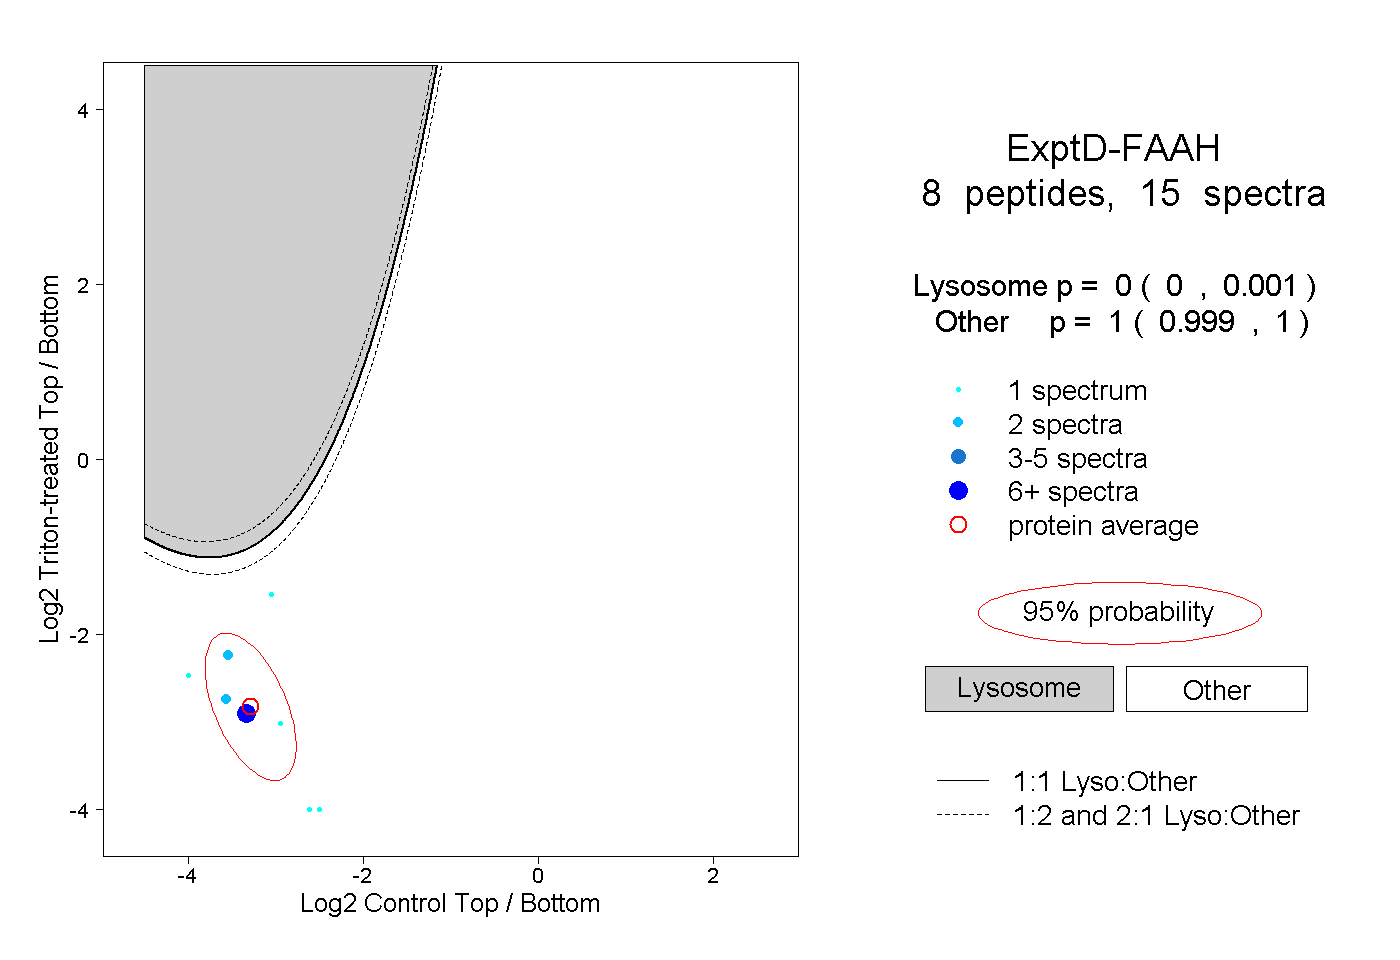
0.000 | 0.001
0.999 | 1.000